Introduction
While difficult to predict with any degree of confidence the duration, outcome, and global economic aftermath of the tragic coronavirus pandemic, our current expectation is for:
- continued supportive global monetary policy;
- solid U.S. labor markets,
- sturdy personal consumption,
- decent economic growth;
- somewhat higher levels of financial market volatility than experienced in 2019
From a portfolio positioning standpoint, we counsel caution and conservatism — with shorter duration, higher-grade exposure in the fixed income realm, and caution around overexposure to high-PE growth stocks, instead emphasizing high-quality defensive sectors with more reasonable earnings multiples and well-covered dividend support.
“One picture is worth a thousand words.” The influential Norwegian realist playwright Henrik Ibsen (1828-1906) first said “A thousand words leave not the same deep impression as does a single deed.” After his passing, this saying was plagiarized and paraphrased into its modern expression: in March 1911, the Syracuse, New York Advertising Men’s Club held a banquet to discuss journalism and publicity. In an article in The Syracuse Post-Standard newspaper describing the dinner, the author quoted his editor as saying: “Use a picture. It’s worth a thousand words.”
Asset Bubbles
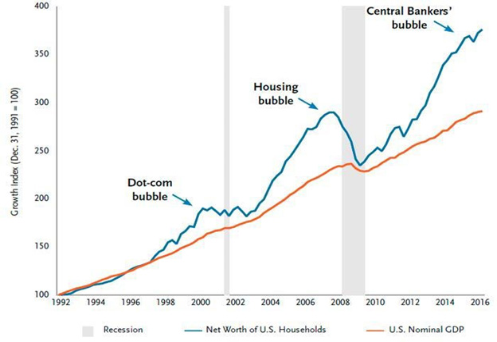
Takeaway: With plenty of good news driving financial asset prices, including: accommodative monetary authorities; a relaxation of trade tensions; the vote taken to conclude the impeachment proceedings; a robust labor market and solid wage growth; expansionary January readings in the ISM-Manufacturing and ISM-Nonmanufacturing indices; and in Germany (despite December’s Industrial Production weakness) an apparent bottoming in manufacturing orders and business expectations, we think it is important to keep in mind the outsized growth rate of U.S. households’ net worth compared to the growth rate of U.S. nominal GDP. As the old saying goes, “trees don’t grow to the sky,“ and in our opinion, the length and strength of the bull markets in stock and bond prices should invoke increased caution, vigilance, and portfolio protection through rebalancing, risk management, and adequate cash levels where appropriate.
Financial Conditions
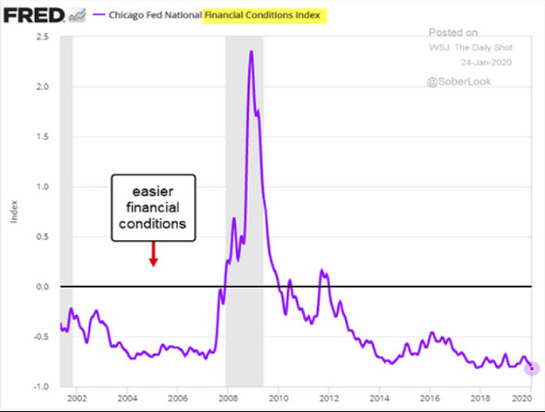
Takeaway: The Chicago Federal Reserve National Financial Conditions index — a weighted average of 105 indicators of risk, credit, and leverage in the financial system — is registering the easiest financial conditions in 20 years, providing a tailwind to financial asset prices. Although this can be seen as being supportive of continuing strength in risk assets, it is hard to know how long these conditions will/can last and how much they may be propping up the economy. This uncertainty is one of the reasons why we have a conservatively constructive investment stance at this time.
U.S. 10-Year Treasury Yields
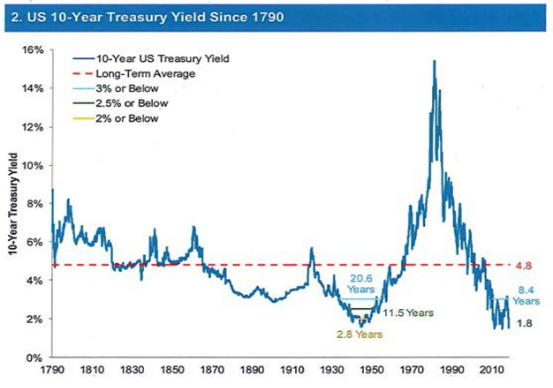
Takeaway: It is important to keep in mind how historically low current interest rates are, seen over a 230-year time frame. When the 10-year U.S. Treasury yield was approaching 16% in 1979-1980, it was rare for investors to contemplate 10-year U.S. Treasury yields below 2%, where they traded for various lengths of time in 2012, in 2015, and 2016, and where they have languished ever since August 2019. Pointing to the 1870–1950 era of yields almost continuously below 4% in the United States, a number of economists maintain that such low yields may endure for quite some time — owing to low economic growth and contained inflation (due to technological progress and the price-awareness and price-reducing effects of the internet, among other factors). For now, we are of the opinion that the monetary stimulus-driven U.S. and global economy may in fact surprise to the upside this year, assuming the negative impact of the coronavirus on GDP is relatively contained, causing a modest rise in yields toward the end of 2020.
The Wuhan Coronavirus
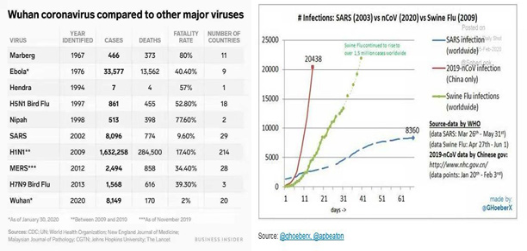
Takeaway: Comparing the Wuhan coronavirus to other major viruses of the past half century shows a considerably lower fatality rate but a higher infection rate (in China) than the global infection rates reported during 2002 SARS and 2009 swine flu (H1N1) pandemics. Although the number of cases is now significantly higher than in the charts above (over 44,000 as of Feb 12th), the fatality rate has continued to hover around 2% as shown. From a fundamental health and economic standpoint, key questions involve the degree of success the authorities will have in containing the virus; the speed and efficacy of vaccine development and application; the immediate and intermediate-term effects on travel, oil demand, global technology supply chains, and industrial activity; consumer and investor psychology and behavior; and associated repercussions for financial stability and monetary policy. From an investment standpoint, investors should closely assess those securities and sectors which have experienced selling pressure due to virus-related worries, while considering the likely speed and magnitude of any rebound associated with more constructive outcomes and a return to normalcy. The facts are that the reported number of cases is rising but at a slower rate and it is still difficult to forecast the accuracy of the reported number of cases and the potential intermediate to long term impact on Chinese and global GDP. We don’t see a need to alter strategically diversified portfolios at this point.
Leading Economic Indicators
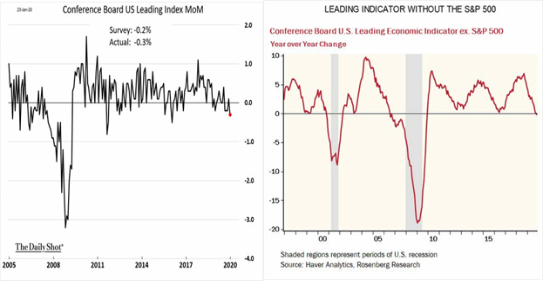
Takeaway: The Conference Board Leading Economic Index (LEI) for the U.S. uses ten key variables (including, among others, employment and manufacturing data, housing building permits, spreads between 10-year U.S Treasury bonds and the fed funds rate, the inflation-adjusted M-2 money supply, consumer sentiment, and the S&P 500). Historically, these variables have turned downward before a recession and upward before an expansion. Driven by large negative contributions from rising unemployment insurance claims and a drop in housing permits, the LEI declined 0.3 percent in December to 111.2 (2016 = 100), following a 0.1 percent increase in November, and a 0.2 percent decline in October. Our view is that even though the LEI has declined in four of the past five months, financial conditions and consumers’ participation in the economy remain positive, which should support U.S. real GDP growth in the neighborhood of 2 percent for 2020.
The Baltic Freight Dry Shipping Index
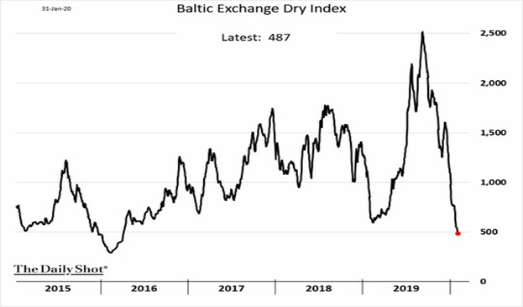
Takeaway: Followed closely and commented on with some degree of frequency by financial professionals, the Baltic Dry Index (BDI) has been issued daily since January 1985 by the Baltic Exchange (formed in 1823) and reflects: the freight shipping rates for dry cargoes including grain, building materials, coal, and iron ore; the demand for shipping capacity versus the supply of dry bulk carriers (the ships themselves); and in recent decades by extension, perceptions about the health of the Chinese economy (as China has been a significant importer of these dry bulk tradeables). Because dry bulk materials serve as raw material inputs to the production of intermediate and finished goods, including concrete, steel, electricity, and food, the index has also been viewed as an efficient leading economic indicator of global economic growth and production even in a more service oriented global economy. In our opinion reflecting some degree of slowing in China’s GDP, the sharp drop in the BDI has been a matter of some concern to us — dictating portfolio defensiveness and vigilance — particularly as the world considers the severity and implications of the Wuhan coronavirus, not only on Chinese economic activity, but also on Asian, European, and other countries meaningfully linked with China from a trade and supply-chain standpoint. Hastening to avoid drawing too draconian a conclusion from its February 6 reading of 430, we nevertheless note that the BDI is down 96.4% from its all-time high of 11,793 reached in May 2008.
Blow-Off U.S. Equity Market Tops
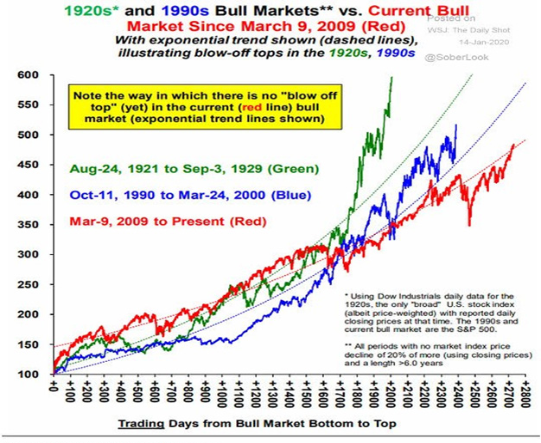
Takeaway: Quite a number of market prognosticators have maintained that the current bull market — which began on March 9, 2009 — is not likely to come to an end and reach its peak without widespread popular equity bullishness morphing into the classic parabolic price increase that characterizes a final euphoric price blow-off. Despite pockets of currently overextended valuations in certain highly-traded technology and tech-enabled companies, given the net selling of equities on balance by U.S. households throughout a significant portion of this bull market run, we are inclined to agree. In football terms, while the two-minute warning has not yet been sounded, in our opinion, we appear to be somewhere in this bull market’s fourth quarter.
Commodity Returns vs. U.S. Equity Returns
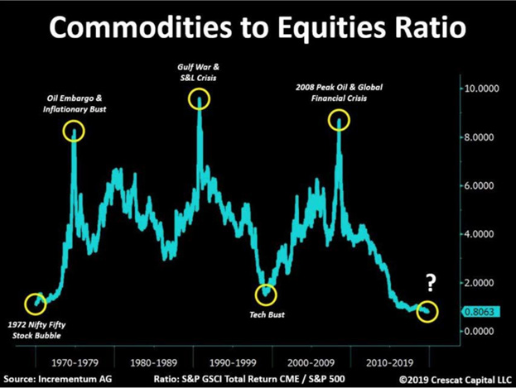
Takeaway: Low inflation, competition from more than a decade of rising prices for financial assets, and global recessionary forces have contributed to multiyear stagnation and neglect of real assets as an asset class. In our opinion, high levels of global indebtedness, central banks’ balance sheet expansion through quantitative easing (money printing), and sovereign debt monetization argue for commencement of exposure to real assets, which may include natural resource equities, infrastructure, energy related assets, real estate, precious metals, and other forms of exposure to commodities.
The Kismet of Energy
Inflation Adjusted Per-Barrel Prices for West Texas
Intermediate Crude Oil (U.S. recessions = shaded bars)
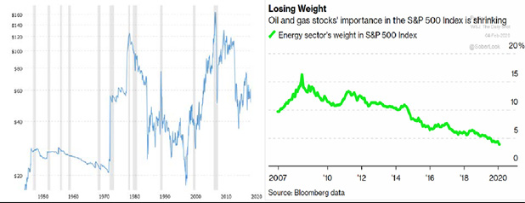
Takeaway: With heightened investor focus on de-carbonization by pension funds, endowments, foundations, and other investors, the oil and gas sector has in recent years been downgraded, “tobaccofied,” and even subject to some degree of revilement and vilification (the latter two nouns each tracing their origin to the Latin word vilis meaning “cheap,” or “of low value”). The energy sector has shrunk to a miniscule 4% of the total market capitalization of the S&P 500, down from over 15% in 2008 and close to 30% in 1980. Oil and gas remain a critically important element of the global economy. In our opinion, those energy sector companies able to continue investing in operations, manage the transition to New Energies, and maintain their dividend capacity represent attractively-valued income-generating investments for the decade ahead.
DISCLOSURES
*Aaron Wealth Advisors LLC is registered as an investment adviser with the Securities and Exchange Commission (SEC). Aaron Wealth Advisors LLC only transacts business in states where it is properly registered or is excluded or exempted from registration requirements. SEC registration does not constitute an endorsement of the firm by the Commission nor does it indicate that the adviser has attained a particular level of skill or ability.
*This report is a publication of Aaron Wealth Advisors LLC. Information presented is believed to be factual and up-to-date, but we do not guarantee its accuracy and it should not be regarded as a complete analysis of the subjects discussed. All expressions of opinion reflect the judgment of the author as of the date of publication, are subject to change, and may not be the opinion of Aaron Wealth Advisors
*Information contained herein does not involve the rendering of personalized investment advice but is limited to the dissemination of general information. A professional adviser should be consulted before implementing any of the strategies or options presented.
*Information is not an offer to buy or sell, or a solicitation of any offer to buy or sell the securities mentioned herein.
*Past performance may not be indicative of future results. Therefore, no current or prospective client should assume that the future performance of any specific investment, investment strategy (including the investments and/or investment strategies recommended by the adviser), or product made reference to directly or indirectly, will be profitable or equal to past performance levels.
*All investment strategies have the potential for profit or loss. The firm is not engaged in the practice of law or accounting. Content should not be construed as legal or tax advice. Always consult an attorney or tax professional regarding your specific legal or tax situation.
*This material is proprietary and may not be reproduced, transferred, modified or distributed in any form without prior written permission from Aaron Wealth Advisors. Aaron Wealth reserves the right, at any time and without notice, to amend, or cease publication of the information contained herein. Certain of the information contained herein has been obtained from third-party sources and has not been independently verified. It is made available on an “as is” basis without warranty. Any strategies or investment programs described in this presentation are provided for educational purposes only and are not necessarily indicative of securities offered for sale or private placement offerings available to any investor.