
WHERE WE ARE
The weeks since mid-April have featured a number of important, even historically significant, developments, including:
(I) Slowing growth rates of coronavirus infections, hospitalizations, and fatalities in parts of America and Europe, accompanied by warmer weather in the Northern Hemisphere, and steps to ease mandatory lockdowns and stay-at-home restrictions, allowing some incipient levels of commercial activity and business reopening;
(II) Cycles of hope, disappointment, and hope again following mortality-reducing pharmaceutical interventions and/or very preliminary test results (that produced neutralizing antibodies and no serious reactions) from one and possibly more of the seven experimental and older-technology vaccines that have begun human testing — out of the more than 100 coronavirus vaccines in development worldwide;
(III) Record levels of U.S. filings for unemployment insurance benefits (a total of 36.5 million workers as of May 14), together with massive increases in the S. unemployment report (14.7%) and underemployment report (22.8%) for the April jobs data released on Friday, May 8th;
(IV) Multitrillion-dollar business, state and local government, and payroll assistance relief packages passed by the S. Congress, continued massive Quantitative Easing (“bond buying through money creation”) and other targeted financial-assistance measures implemented by the Federal Reserve, and enormous issuance of U. S. Treasury debt securities to fund record federal budget deficits;
(V) Brief storage- and Exchange Traded Funds-related episodes of negative crude oil futures pricing, even as numerous oil producing nations’ coordinated reductions in global crude oil supply remained insufficiently steep to balance the sharp drop-off in global crude oil demand;
(VI) Against a background of vastly diminished pricing power, as measured by declining month-over-month and year-over-year consumer and producer price indices — increasingly gloomy 2Q20 GDP forecasts have been issued and dire data reports have been released on GDP contraction, retail sales, manufacturing, industrial production, and a number of noteworthy bankruptcy filings;
(VII) A substantial percentage of publicly-traded companies have ceased giving forward earnings guidance, trimmed their real estate footprint, furloughed or eliminated a number of middle management jobs, suspended stock buybacks, and reduced or eliminated dividend payouts;
(VIII) With U.S. equity VIX volatility levels generally trending downward, a not inconsiderable number of equity trading sessions have witnessed stock indices suddenly change directions several times on an intra-day basis, oftentimes late in the trading day, with few obvious reasons for such swings;
(IX) Continued, and in some cases, heightened, degrees of dissonance, disagreement, decoupling, divisiveness, and disassociation have prevailed in several quarters of domestic S. politics, as well as in certain important U.S. bilateral and multilateral country relationships in the international realm; and
(X) Higher mid-May prices compared to April 14 have been registered for the five largest market capitalization U.S. equities, the S&P 500 and NASDAQ stock market indices, intermediate- and long-term U.S. Treasury securities, gold, gold mining shares, silver, bitcoin, crude oil, and master limited partnerships, while lower prices over the same time period have been experienced for natural gas, Baltic Dry freight shipping rates, high-yield bonds, bank stocks, and real estate investment trusts.
PORTFOLIO POSITIONING
The course of asset prices in the period ahead is likely to be determined by:
(I) How quickly employment, earnings, education, risk-taking, healthcare, energy prices, social distancing, consumer sentiment, and business confidence can approach pre-pandemic conditions once infections fall, the lockdowns diminish on a widespread basis, and definite answers emerge to questions concerning if and how material second infection waves will occur;
(II) Whether or not therapeutic and preventive vaccines can be developed, manufactured, and distributed in sufficient amounts to achieve national and international disease control or societal immunity;
(III) The forms and strength of post-pandemic economic and financial behavior, including (1) the modes and frequency of travel, personal savings rates, discretionary e-commerce spending, and in-person outlays for retail, lodging, tourism, restaurants, entertainment, healthcare, and other services, by the household sector, (2) borrowing, spending, hiring, and targeted cash levels in the business sector, and (3) the sourcing and spending of funds by state and local governments;
(IV) Whether the massive fiscal spending programs legislated by Congress, as well as the balance sheet expansion, emergency lending programs, and monetary interventions by the Federal Reserve and other major central banks can supply adequate liquidity and efficacious financial support to (1) help households bridge the gap until employment levels meaningfully improve, (2) help businesses — especially in the energy sector — avoid serious solvency problems, and (3) help prevent core price level changes from sinking into and getting enduringly mired in deflation territory;
(V) Rhetoric and reality before and after the U.S. national elections (on Tuesday, November 3rd, 2020, 154 days, or 22 weeks from June 3rd) relating to government entanglement and control, worker safety, pandemic and other emergency preparedness, voting protocols, corporate concentration, regulation, accounting quality and transparency, corporate stock buybacks, healthcare coverage, social assistance, and the taxation of income, inheritance, and capital gains; and
(VI) How the U.S.-China relationship evolves along several vectors, including tariffs/trade, direct and portfolio investment flows, supply chain structures, technology transfer, press coverage and media positioning, intellectual property protection, currency management, cybersecurity, espionage, and geopolitical projection.
From an asset allocation standpoint, we continue to counsel meaningful portfolio diversification, with new investment money put to work in stages:
(1) If already holding cash, one may consider keeping some level of continued reserves to judiciously deploy into high- quality assets on price weakness;
(2) In equities, for the time being we tend to favor S. domestic over international developed and developing market equities, growth over value, and large cap companies over small and mid-cap companies. Emphasis may be placed on sectors (including technology, healthcare, and consumer staples), companies, and asset managers who can benefit from tailwinds including (1) incremental growth in a range of economic recovery scenarios, (2) economic repair and the release of pent-up consumer demand, and (3) onshoring as a significant driver of the investment cycle in housing and capital spending. Strategically speaking at the company level in equities, we emphasize continuation of long-term exposure (adding on price pullbacks) to firms possessing fortress-like, cash-rich balance sheets, limited debt, positive free cash flow generation, dividend strength, and defensible business models able to generate high returns on equity over a long time frame;
(3) In taxable and tax-exempt fixed income, emphasis should be placed on short-to-intermediate maturities/durations, and on issuers at the high- quality end of the rating spectrum — both in investment grade and in high-yield bonds; and
(4) In real assets and alternative investments, we continue to favor some exposure to high-quality master limited partnerships, investments in private credit, and opportunistic strategies particularly in the distressed space that are positioned to extract significant value in the aftermath of the pandemic dislocations.
(5) The global economy has now experienced three low-probability, high-impact negative events since the turn of the century – the September 11th terrorist attacks on the U.S., the Great Recession of 2008-2009, and now the global coronavirus pandemic – which were unexpected, unforeseeable, and These types of events, often called Black Swans, can wipe out a lifetime’s worth of value and economic growth in an incredibly short time period. Using the traditional, though inappropriately applied to real-world events, “Bell-Curve”, the probability of one such event occurring can be estimated to be less than 0.135% in any given year. Assuming these events are independent of each other, the probability of three occurring over a 20-year period is approximately 0.00000024%. In the coming weeks we will be producing a piece on uncertainty, behavioral finance, and innate human biases that lead to the misapplication of traditional economic models to real world events which will go into greater detail on how we should actually think about risk; but for now, it is important to note that this will be a crucial element of our portfolio management and asset allocation process going forward.
THE PATH OF U.S. UNEMPLOYMENT
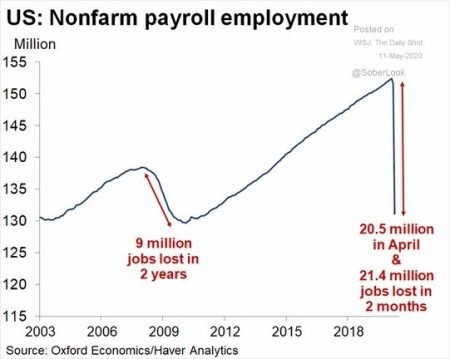
Wiping out more than a decade’s total employment gains in a single month and driven by government-mandated shutdowns across broad swaths of the U.S. economy, April’s nonfarm payrolls declined by a historic 20.5 million workers. A total of 7.7 million jobs were cut in the leisure and hospitality sectors (among the first to be hit by the coronavirus-related business closures); 2.5 million in education and healthcare; 2.1 million in the retail sector; 1.3 million in manufacturing; and 980,000 state and local government employees. As reflected in the first chart, the combined March-April 2020 job losses of 21.4 million amount to more than double the 9 million job losses suffered during the mid- 2007 to early 2009 Global Financial Crisis (a time of extreme stress in worldwide financial markets and banking systems).
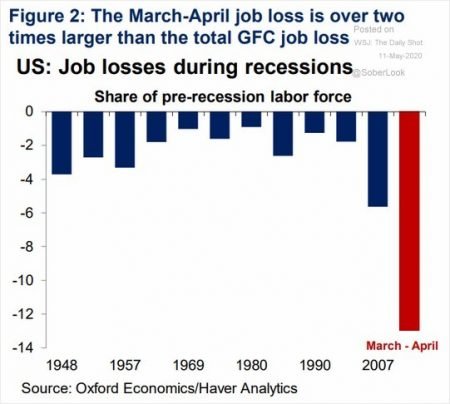
The second chart shows that the two-month unemployment spike represents close to 14% of the pre- recession labor force, compared to 5.8% of the pre- recession labor force in the recessionary conditions that began in 2007, and 3.8% of the pre-recession labor force in the recessionary conditions that began in 1948.
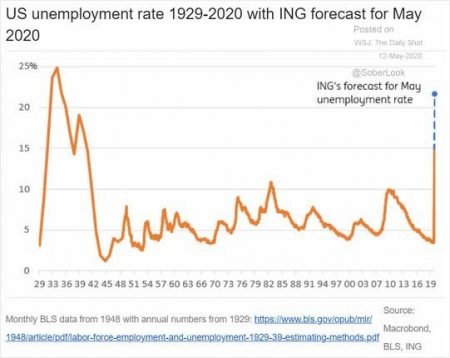
Even though well below the 25% unemployment rate economists estimate was experienced during the Great Depression of the early 1930s, the April unemployment rate reached a record 14.7%, surpassing the previous record level of 10.8% for data since 1948. The third chart shows that May’s unemployment rate (to be released at 8:30 AM Eastern time on Friday, June 5th) Is estimated by some economists to reach as high as 20%.
An equally dire measure of April’s degree of joblessness is captured by the 22.8% reading of the so-called U-6 underemployment measure, which includes: (i) unemployed workers; (ii) workers who have stopped looking for work; (iii) workers who would like to work but have not looked for work; and (iv) part-time workers who would like to work full-time but who have been unable to because of economic conditions.
In our opinion, the duration and severity of the unemployment (and underemployment) crisis represent critical factors determining consumer confidence and personal consumption expenditures. One reason underpinning our continued cautious investment stance centers on the likelihood that it may very well take longer than current financial market prices reflect for jobs growth, consumer confidence, personal consumption, and businesses’ reopening to return to anywhere near the conditions prevailing at the beginning of 2020.
THE PATH OF U.S. – CHINA RELATIONS
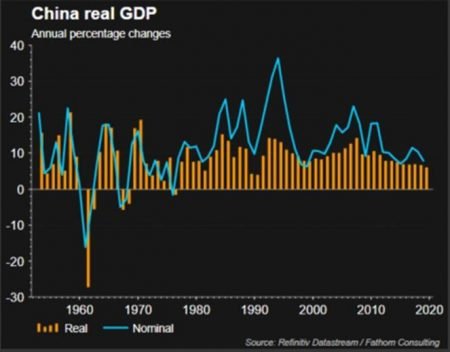
The relationship between America and China represents a critically important input — some would say the most critical influence — to the economic and political outlook for both countries and globally, for the overall investment climate, and thus, for the overall direction of financial asset prices. The chart left above (prepared by CEIC Data, founded in Hong Kong in 1992) shows that after growing +6.8% In 2017, China’s real GDP grew +6.6% in 2018 and +6.1% in 2019. For the first quarter of 2020, China’s real GDP declined at a 6.8% annual rate, the first contraction since records began in 1992 and the weakest growth rate since 1976. Consensus estimates by 62 economists surveyed by Reuters and Refinitiv currently forecast real GDP growth of +2.5% for 2020 as a whole, followed by +9.2% in 2021.
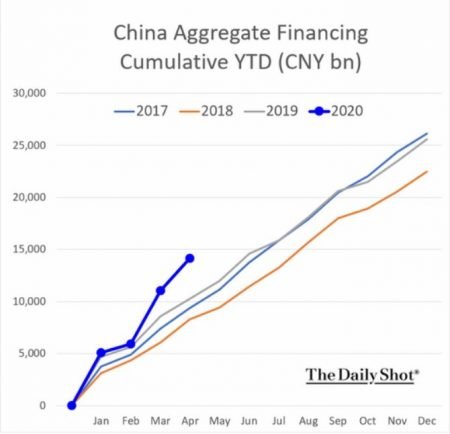
As shown in the second chart above, to counteract this year’s economic slowdown, China’s authorities have applied significant fiscal support, regulatory relief, and monetary stimulus, with close to 15 trillion renminbi (over $2 trillion) in aggregate financing supplied to the economy from all sources thus far in 2020 — more than 50% above the average of the last three years.
After the normalization of full diplomatic relations in 1979 followed by more than four decades of engagement between the two countries, and with each society facing increased nationalist sentiment, recessionary economic conditions, and abusive language over various aspects of the origins and spread of the coronavirus pandemic, the U.S. and China appear to have entered a fraught new phase in their relationship, characterized by growing ideological differences, diminishing economic and financial interdependence, geopolitical tension, heightened competition, retaliatory actions in the diplomatic and media spheres, technological divergence, decoupling, withdrawal, suspicion, rivalry, mistrust, reprisals, and other expressions of mutual animosity.
How the U.S. and China treat one another — rhetorically and substantively — in the months and years ahead is virtually certain to profoundly affect the pace and patterns of globalization, regional alliances, global GDP growth trends, supply chain dynamics, transnational capital flows, financial market conditions, payment mechanisms, and currency values.
Recognizing the difficulties of quantifying the risk of — much less assigning numerical probabilities to — various outcomes affecting the U.S.- China relationship, and how such scenarios could affect asset prices, we currently advise investors to consider what tactical and strategic portfolio actions should be taken in advance of, during, and following any meaningful deterioration or flareup in the Sino-American connection. In the face of elevated sniping and suspicion between the two nations, our preference at this point in time for tactical investors would be to consider devoting a greater-than-normal proportion of the portfolio to perceived safe-haven assets such as cash instruments, precious metals, and very high-quality short-term fixed income securities.
THE PATH OF THE U.S. ECONOMY
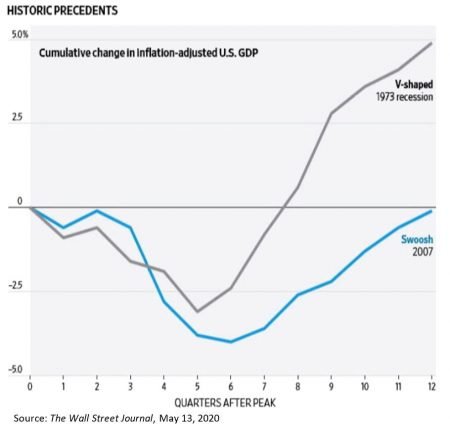
Much media attention and economists’ narratives have centered on the magnitude and duration of the decline in the U.S. economy, as well as how fast the country can return to pre-crisis levels of economic output. At 2,820.00 as of the close on May 13, the strength and speed of the S&P 500 rebound — up +26.0% from its March 23 closing low and down -16.7% from its February 19 record closing high — possibly indicate that the U.S. economy will experience a “V-shaped” recovery from the COVID-19 pandemic. As shown in the historic precedents panel above, the two-year 1973 V-shaped economic recession featured a -3.0% GDP drop-off lasting approximately five calendar quarters (1.25 years) followed by a swift upturn (taking only three quarters) to return to pre-recession levels of economic activity.
The right-hand panel also displays an instance of a so-called “swoosh“ recovery, also labeled as an extended “U-pattern“ (experienced in and following the 2007 recession), in this case characterized by a deeper economic decline of -4.0% lasting six calendar quarters (1.5 years), followed by a drawn-out economic recuperation period taking 1.5 years to get back to pre-recession economic conditions.
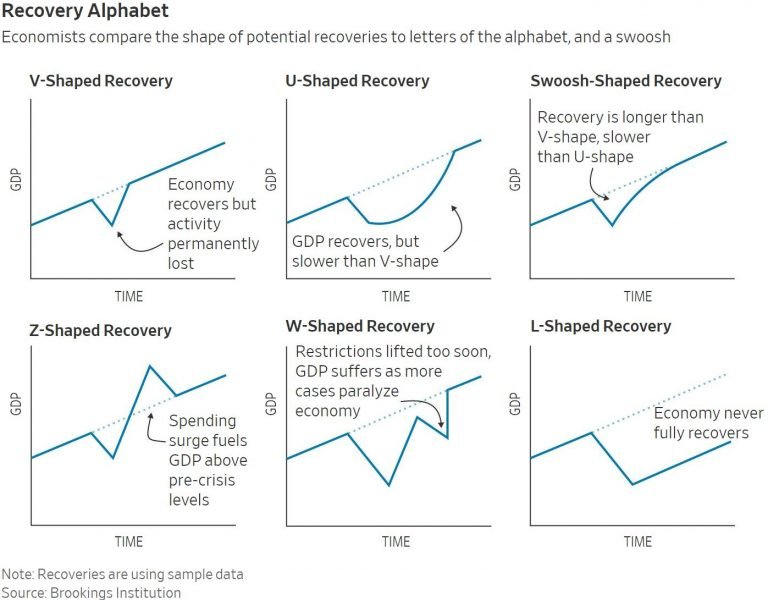
Other post-recession recovery trajectories are also shown in the right panel above (not portrayed here on the same scale as the upper left panel). In a “V-shaped“ recovery, the economy experiences a swift drop-off, followed by a roughly equally swift recovery to its long-term growth rate.
A “U-shaped“ recovery experiences the same economic contraction, but takes longer to return to pre-recession levels of economic activity. A “swoosh-shaped” recovery takes somewhat longer than “V- shaped“ and somewhat shorter than “U-shaped“ episodes to regain pre-recession activity levels.
A “Z-shaped“ recovery trajectory tends to exhibit a somewhat shallow economic retrenchment, followed by a relatively rapid economic surge to above pre-crisis levels. A “W-shaped“ recovery exhibits some number of setbacks and retrenchments, prolonging economic distress and often lengthening the time it takes to regain pre-recession economic output.
In an “L-shaped“ recovery, an economy drops off quickly and then exhibits feeble, halting, sideways growth similar to that witnessed in Japan for many years following the significant and long-lasting declines which began in late 1989 in the Japanese equity and real estate markets.
Cognizant of the significant challenges inherent in predicting the path of this heretofore unencountered coronavirus- and lockdown-induced economic downturn, and recognizing that U.S. equity indices appear to be anticipating a “V-shaped” recovery, we nevertheless currently expect more of a drawn-out, “U-shaped,” or “swoosh-shaped” economic recovery — and thus believe tactical investors should consider maintaining a cautious, defensively-oriented asset allocation and investment strategy — based on our assessment of the following factors:
(I) The likelihood of a crisis in the funding of state and local governments, prolonged harm to the economy‘s productive capacity, potential losses in the commercial real estate sector (with associated credit write-offs suffered by banks and other lenders), long-lasting damaging effects on consumer and business confidence of massive labor force layoffs (disproportionately hitting service sector workers, many of whom face low income and low or no savings), and widespread business closures (a not insignificant number of which may be unlikely to reopen);
(II) Owing to political disagreements — over the recipients, channels, and uses of further assistance — federal deficit concerns, high levels of existing indebtedness, energy market ructions, and the inefficacy, inadequacy, and mistargeting of fiscal, monetary, and regulatory rescue and support initiatives;
(III) Early signs that social distancing continues to affect the economic activity that has been only haltingly returning to states that have moved to re-open businesses, as many consumers and workers continue to stay home and avoid public spaces out of fear of contracting the virus;
(IV) The underappreciated knock-on effects of deep contractions in economies outside the S. (in mid-April, despite aggregate fiscal support measures totaling $8.7 trillion since the onset of the pandemic, the International Monetary Fund predicted a -3.0% contraction in 2020 global GDP, with advanced economies declining -6.1% and emerging and developing economies contracting by -1.0% — in mid-June, the IMF will publish downward revisions to these forecasts, reflecting the further spread of the coronavirus and its intensified impact in recent weeks); and not least,
(V) Persistent concerns over critical gaps in testing and tracing capability, a potential rebound and second wave of infections (partially arising from worrisome reports of spikes and new infections in China, South Korea, and Germany, where restrictions have been loosened), possible virus mutations, the pace of development of preventive and therapeutic treatments, and whether or not it is possible for herd immunity to be.
THE PATH OF U.S. EQUITY PRICES
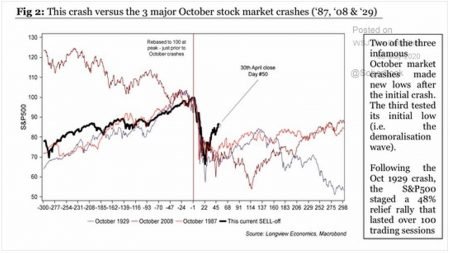
Given the swiftness (just 23 trading days) and magnitude (-33.9%) of the decline in the S&P 500 index from its all-time record high of 3,386.15 on February 19th to 2,237.40 on March 23rd, questions naturally arise about the sustainability of the sudden and sharp equity price recovery and whether the March 23rd lows will be retested — or perhaps even falling to the downside. Fully aware that “although history never exactly repeats itself, it may sometimes rhyme,“ some perspective is provided in the chart above, which compares the February–March 2020 crash in the S&P 500 index to the major October stock market crashes that began in 1987, 2008, and 1929. New stock market lows were plumbed following October 2008 and October 1929 (following the October 1929 crash, the S&P 500 mounted a +48% relief rally that lasted over 100 trading sessions, before turning decisively downward again), and the October 1987 stock market crash tested its low, but did not break through to further price weakness.
Several points have been adduced arguing that equity prices are unlikely to retest or puncture the March 23rd closing low for the S&P 500, among them:
(1) The speed and strength of the combined monetary and fiscal policy response, amounting to well over $6 trillion, and perhaps eventually reaching double these amounts or even more;
(2) The fact that the coronavirus pandemic did not adversely affect much of the nation’s internet, electricity, water, telecommunications, and delivery infrastructure, even as it hit a relatively healthy S. economy entering 2020, with low unemployment and high levels of consumer and corporate confidence; and
(3) Significant investor flows into money market funds and cash instruments, consistent with relatively bearish (historically viewed as a contrarian indicator) individual investor positioning, as measured by the weekly survey of investor sentiment conducted by American Association of Individual Investors, with the percentage of respondents expressing bearish views as follows for the ten surveys conducted March 11 through May 13 — 51%, 51%, 52%, 50%, 45%, 43%, 50%, 44%, 53%, and 51%, respectively — with 30% the long-term average bearish sentiment reading.
Even taking into account these sanguine factors, we counsel caution and a focus on high-quality equity, fixed income, and alternative assets, currently assigning a not insignificant probability to the S&P 500 retesting the March 23rd lows, for the following reasons, among others:
(i) As described in Section 3 of this note (The Path of the U.S. Economy), we foresee a more challenging set of economic conditions ahead than appears to be reflected in equity market prices, a view perhaps also reflected by the ultra-low interest rate levels on S. Treasury securities as investors seek safety, even with low yields — In The Wall Street Journal’s May 8-12 monthly survey of 64 economists, June’s unemployment level is projected to reach 17.0%, full-year 2020 U.S. GDP is expected to decline -6.6%, (compared to the previous month’s survey expectation of -4.9%), with 2Q20 GDP estimated to contract at a -32% percent annualized rate, followed by +9.0% in 3Q20 and +6.9% in 4Q20;
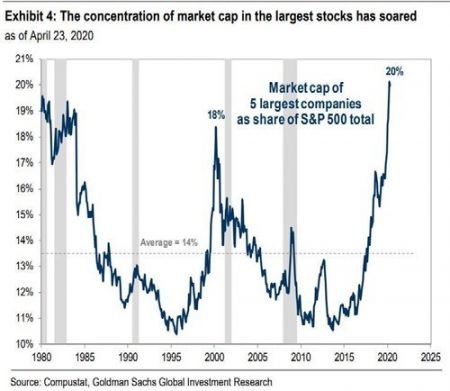
(ii) The narrowness of the stock market rebound, heavily concentrated in the shares of five large companies — Facebook (+4% year-to-date through May 11), Apple (+6%), Microsoft (+17%), Amazon (+29%), and Alphabet/Google (+3%). The upper panel here shows that the equity market capitalization of the top five companies represents a record percentage, 20%, compared to its long-term average of 14%, of the total market capitalization of the S&P 500 index — such heavy concentration in a narrow group of companies — much as in Greek mythology, the Titan Atlas was made by Zeus to hold up the sky on his shoulders — was one of the chief factors for our cautious view of equity market conditions at the beginning of this year, and this newly-intensified lack of breadth remains a meaningful factor underpinning our call for prudence, care, and discernment in asset, security, sector, and investment manager selection;
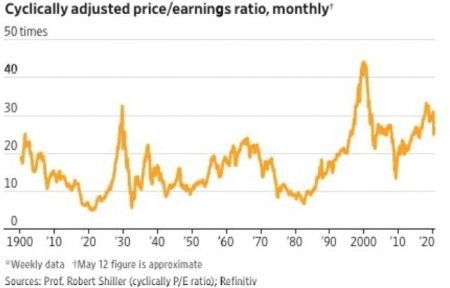
(iii) As measured by the Cyclically Adjusted Price Earnings ratio (also known as the CAPE ratio, or Shiller price-earnings ratio, defined as the stock market price level divided by the 10-year average of inflation-adjusted earnings) equity valuations, with the exception of the dotcom boom era of the late 1990s, are the highest they have been in 70 years, as depicted in the middle chart here — with the CAPE ratio principally used to assess likely future returns from equities over timescales of 10 to 20 years, higher than average CAPE values imply lower than average long term average returns from equities; and
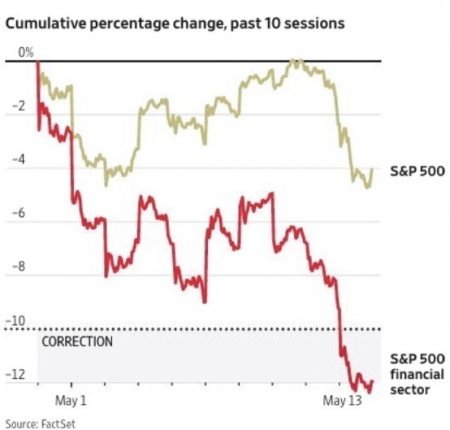
(iv) Through May 14, the continued underperformance relative to the S&P 500 (-11.7% year-to-date and -0.8% over the last twelve months) of the so-called “bodyguards of the market” — the Dow Jones Transportation Index (containing 20 stocks in the railroad, airline, trucking, marine transport, delivery services, and logistics industries, -27.9% YTD and -25.9% LTM), the Russell 2000 Index (a widely quoted measure of small- and mid-capitalization shares, representing approximately 10% of the total equity market capitalization of the Russell 3000 index, -25.8% YTD and -20.5% LTM), and the S&P Financials Index (containing 62 companies in the banking, insurance, credit card, and asset management industries, -33.8% YTD and -15.7% LTM, with increasing underperformance exhibited in the first trading days of May, as shown in the bottom panel here).
THE PATH OF OIL PRICES
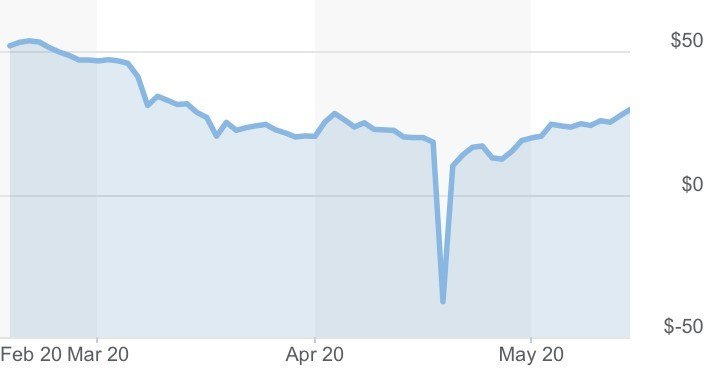
As shown in the panel above, in the midst of governments’ limitations of travel and other economic activity to contain the coronavirus pandemic, and following the April 11th-12th, 2020 coordinated agreement of OPEC and allied oil producers (led by Saudi Arabia and Russia), to cut produc- tion by 9.7 million barrels per day during May and June, front-month NYMEX West Texas Intermediate crude oil futures trended downward and briefly reached a record-low negative pricing of -$37 per barrel on Monday, April 24th for crude to be delivered in May.
Even though the dramatic fall in oil futures prices into deeply negative territory involved certain technical features of oil- based exchange-traded funds and a relatively small number of contracts changing hands, it focused widespread media and investor attention on the continued excess of global oil supply versus demand (21.5 million fewer barrels per day in May compared with a year earlier) and the rapidly dwindling available capacity to store the buildup in oil output.
On May 14, the Paris-based International Energy Agency (IEA) reported that in addition to supply reductions from the so- called OPEC+ group, massive cuts from the United States, Canada, and other countries have reduced total supply much faster than initially anticipated, to a projected 88 million barrels per day in May, down 12 million barrels compared to April. Output from non-OPEC+ countries is forecast by the IEA to decline by another 4 million barrels per day by June. The U.S. is projected to represent approximately 70% of this reduction round, beginning with wells in cost-disadvantaged basins as well as with older, vertically drilled stripper wells.
Building on the speed and magnitude of production cuts, early signs of a partial rebalancing of oil markets have begun to emerge on the demand side, as parts of Europe have begun allowing businesses to reopen, large U.S. states including California and Texas eased lockdown restrictions on May 8th, and the U.S. public appears to be exhibiting a preference for automobiles over public transportation and short-haul flying.
Additional forces in support of higher oil prices include oil-producing nations’ budget needs. According to Royal Bank of Canada’s “OPEC Watch List,“ published March 19th, 2020, central government budgetary oil price break-evens are approximately $65 per barrel for Russia, approximate- ly $94 per barrel for Saudi Arabia, and approximately $90 per barrel for the 13 OPEC member nations averaged as a group —considerably higher than the May 14th closing prices of $27.56 per barrel for WTI and $31.13 per barrel for Brent. Hydrocarbon-based energy is also needed to sup- port global economic growth. The “World Energy Outlook 2019“ published by the International Energy Agency on November 13th, 2019 projects that global energy demand will increase by approximately 30% over the next two decades, with oil and natural gas demand expected to increase for at least the next 10 years.
While the energy sector in 2020 has been faced with: (i) a global pandemic; (ii) a government policy-induced business retrenchment in much of the world; (iii) a Saudi Arabia-Russia oil price war; and (iv) wholesale divestment of fossil-fuel securities by a number of institutional investors, we are of the opinion that these developments may be already largely reflected in energy asset prices and attractive risk-reward conditions may be available for judiciously-selected energy securities over a one- to three-year time frame. For patient, contrary-minded investors, we continue to strictly emphasize quality in purchasing the equity and debt issues of companies in the energy space, focusing on enterprises with:
(1) Diversification in upstream, midstream, and downstream operations;
(2) Discipline in capital allocation, with judicious levels of capital spending; and
(3) Dividend stability and growth, focusing on balance sheet strength and free cash flow
DISCLOSURES
*Aaron Wealth Advisors LLC is registered as an investment adviser with the Securities and Exchange Commission (SEC). Aaron Wealth Advisors LLC only transacts business in states where it is properly registered or is excluded or exempted from registration requirements. SEC registration does not constitute an endorsement of the firm by the Commission nor does it indicate that the adviser has attained a particular level of skill or ability.
*This report is a publication of Aaron Wealth Advisors LLC. Information presented is believed to be factual and up-to-date, but we do not guarantee its accuracy and it should not be regarded as a complete analysis of the subjects discussed. All expressions of opinion reflect the judgment of the author as of the date of publication, are subject to change, and may not be the opinion of Aaron Wealth Advisors.
*Information contained herein does not involve the rendering of personalized investment advice but is limited to the dissemination of general information. A professional adviser should be consulted before implementing any of the strategies or options presented.
*Information is not an offer to buy or sell, or a solicitation of any offer to buy or sell the securities mentioned herein.
*Past performance may not be indicative of future results. Therefore, no current or prospective client should assume that the future performance of any specific investment, investment strategy (including the investments and/or investment strategies recommended by the adviser), or product made reference to directly or indirectly, will be profitable or equal to past performance levels.
*All investment strategies have the potential for profit or loss. The firm is not engaged in the practice of law or accounting. Content should not be construed as legal or tax advice. Always consult an attorney or tax professional regarding your specific legal or tax situation.
*This material is proprietary and may not be reproduced, transferred, modified or distributed in any form without prior written permission from Aaron Wealth Advisors. Aaron Wealth reserves the right, at any time and without notice, to amend, or cease publication of the information contained herein. Certain of the information contained herein has been obtained from third-party sources and has not been independently verified. It is made available on an “as is” basis without warranty. Any strategies or investment programs described in this presentation are provided for educational purposes only and are not necessarily indicative of securities offered for sale or private placement offerings available to any investor.