Divorce can often be an emotional whirlwind, leaving you feeling overwhelmed and drained, with little energy to address potentially significant financial upheaval. Building an iron-clad support team is critical in facing these challenges, made up not only by your trusted friends and family, but also by adept legal counsel and an experienced financial advisor. This team can help you regain your financial footing with confidence.
Understanding the Pillars of Your Divorce Team
Legal Guidance: Family Attorney
Your attorney plays a crucial role in dealing with the legal aspects of your divorce. From handling all the paperwork to negotiating a fair divorce settlement, their expertise becomes the cornerstone of your decision-making process.
Financial Counsel: Financial Advisor
Your financial advisor becomes a beacon of rational decision-making by ensuring you understand the financial consequences of various settlement scenarios. An objective view and focused approach can keep you anchored, helping make decisions that favor your long-term financial stability.
Selecting the right financial advisor is a critical step in this journey. It’s important to choose an advisor who is a fiduciary, legally binding them to act in your best interest. Your advisorshould be able to provide impartial advice without any bias.
Once the divorce proceedings conclude, your financial advisor can help you navigate life changes and manage your financial health. This involves understanding new tax implications and recalibrating your financial plans as your life evolves.
Considerations for Financial Stability Post-Divorce
Reevaluating your financial status after a divorce is crucial for long-term stability and growth. Here are some additional steps to consider:
Update Your Estate Plan
After a divorce, it’s essential to update your estate plan. This includes revising your will, powers of attorney, updating beneficiaries on life insurance policies and retirement accounts, and modifying any trust agreements. Ensure that your estate plan reflects your new marital status and financial priorities.
Reassess Retirement Plans
Divorce can have significant implications on your retirement plan. Review your retirement accounts and contributions and ensure that your retirement goals are still achievable. Consider consulting a financial advisor to make any necessary adjustments.
Evaluate Insurance Coverage
It’s important to reexamine your insurance needs, including health, home, auto, and life insurance. Ensure that you have adequate coverage for yourself and any dependents. Updating your insurance policies can provide peace of mind and financial security.
Work with Your Financial Advisor
Continuing to work with a qualified financial advisor can help you navigate the complexities of your new financial landscape. A financial advisor can offer tailored advice, helping you make informed decisions that support your long-term goals.
Final Thoughts
Divorce marks the beginning of a new chapter in your personal and financial lives. By taking proactive steps and leveraging the expertise of a team, including a financial advisor, you can secure your financial future and embark on this new journey with confidence. Aaron Wealth Advisors would be honored to support you every step of the way. Contact us today to learn how we can help you achieve financial independence and peace of mind.
DISCLAIMER *Aaron Wealth Advisors LLC is registered as an investment adviser with the Securities and Exchange Commission (SEC). Aaron Wealth Advisors LLC only transacts business in states where it is properly registered or is excluded or exempted from registration requirements. SEC registration does not constitute an endorsement of the firm by the Commission nor does it indicate that the adviser has attained a particular level of skill or ability.
*This material is not intended to be a recommendation or investment advice, does not constitute a solicitation to buy or sell securities, and is not provided in a fiduciary capacity. The information provided does not take into account the specific objectives or circumstances or any particular investor or suggest any specific course of action. Investment decisions should be made based on an investor’s objectives and circumstances and in consultation with his or her advisors. The information contained in this presentation represents factual information, analysis, and/or opinions regarding various investments. Any opinions expressed in this material reflect Aaron Wealth’s views as of the date(s) indicated in the Presentation and are subject to change.
*Past performance may not be indicative of future results. Therefore, no current or prospective client should assume that the future performance of any specific investment, investment strategy (including the investments and/or investment strategies recommended by the adviser), or product made reference to directly or indirectly, will be profitable or equal to past performance levels.
*This document contains forward-looking statements, including observations about markets and industry and regulatory trends as of the original date of this document. Forward-looking statements may be identified by, among other things, the use of words such as ”expects,” “anticipates,” “believes,” or “estimates,” or the negatives of these terms, and similar express results could differ materially from those in the forward-looking statements as a result of factors beyond our control. Recipients of the information herein are cautioned not to place undue reliance on such statements. No party has an obligation to update any of the forward-looking or other statements in this document.
*All investment strategies have the potential for profit or loss. The investment strategies illustrated in this document and listed above involve risk, including the risk of loss of principal.
*The firm is not engaged in the practice of law or accounting. Content should not be construed as legal or tax advice. Always consult an attorney or tax professional regarding your specific legal or tax situation.
*This material is proprietary and may not be reproduced, transferred, modified or distributed in any form without prior written permission from Aaron Wealth Advisors. Aaron Wealth reserves the right, at any time and without notice, to amend, or cease publication of the information contained herein. Certain of the information contained herein has been obtained from third-party sources and has not been independently verified. It is made available on an “as is” basis without warranty. Any strategies or investment programs described in this presentation are provided for educational purposes only and are not necessarily indicative of securities offered for sale or private placement offerings available to any investor.
Bill Andrakakos, CFA, FRM President & Chief Investment Officer
As you navigate the complexities of managing your estate, an important consideration is how to protect assets from excessive taxation. Estate taxes have the potential to significantly reduce the inheritance intended for your loved ones. With thoughtful planning and the right strategies, you can minimize the impact of estate taxes, ensuring that your legacy remains intact for future generations.
Trusts
Trusts are crucial instruments in estate planning. They provide control over the distribution of your assets, potentially lower estate taxes, and they can protect your estate from the probate process. By placing assets in a trust, you can reduce the taxable value of your estate. For example:
Irrevocable Trusts can remove assets from your estate entirely, thus reducing the total estate value subjected to taxes.
Charitable Trusts can reduce estate taxes by directing a portion of the estate to charitable organizations.
Qualified Personal Residence Trusts (QPRT) maintain ownership of your residence allowing you to retain the right to live in the home for a specified period while removing its value from your estate.
Grantor Retained Annuity Trusts (GRAT) can hold appreciating assets and provide an annuity payment stream for a specified term, with any remaining assets passing to beneficiaries free of gift or estate tax.
Gifting
The act of gifting is not just a means of sharing wealth but also a method of reducing taxable estate value. The IRS permits individuals to give a specific sum annually without being subject to gift tax. Regular, planned gifting can strategically lower estate value and thereby the potential estate tax liability. Take advantage of annual gift tax exclusions to transfer assets tax-free each year to beneficiaries.
Charitable Contributions
Charitable donations can also play a role in diminishing the size of a taxable estate. Contributing to charitable organizations, foundations, or trusts not only supports a cause close to heart – but also scales back estate taxes.
Life Insurance
Life insurance payouts typically do not attract income tax. However, they can add to the estate value and incur estate taxes. By assigning the policy to a trust, the benefits can be kept off your estate’s taxable value. By establishing an Irrevocable Life Insurance Trust (ILIT) to hold life insurance policies outside of your taxable estate, they can provide tax-free proceeds to beneficiaries.
Qualified Plans
Utilize retirement accounts and other qualified plans strategically. These assets may have tax advantages and can be structured to minimize estate tax exposure.
Educational Savings Accounts
Educational investments like 529 plans offer another way to reduce an estate’s size while contributing to the future of a child’s education. Contributions grow tax-free if they are used for qualified educational expenses.
Family Limited Partnerships (FLPs)
FLPs can be structured to enable the previous generation to retain control over assets while sharing the financial benefits with other family members. Unlike irrevocable trusts, the members of a family limited partnership can change the terms of the agreement. Additionally, FLPs can offer some decreased liability. Family members who have limited partnership interests can be protected from creditors.
Proactive Planning
Early and regular reevaluation of your estate plan is key to seizing the benefits of a shifting financial landscape and changes in tax laws. Minimizing estate taxes and preserving wealth for beneficiaries requires a thoughtful approach and proactive planning. By working together with financial advisors, estate planning attorneys, and tax professionals you can develop a comprehensive strategy tailored to your specific goals and financial situation. Reach out to find out how Aaron Wealth Advisors can help create a legacy for generations to come.
DISCLAIMER *Aaron Wealth Advisors LLC is registered as an investment adviser with the Securities and Exchange Commission (SEC). Aaron Wealth Advisors LLC only transacts business in states where it is properly registered or is excluded or exempted from registration requirements. SEC registration does not constitute an endorsement of the firm by the Commission nor does it indicate that the adviser has attained a particular level of skill or ability.
*This material is not intended to be a recommendation or investment advice, does not constitute a solicitation to buy or sell securities, and is not provided in a fiduciary capacity. The information provided does not take into account the specific objectives or circumstances or any particular investor or suggest any specific course of action. Investment decisions should be made based on an investor’s objectives and circumstances and in consultation with his or her advisors. The information contained in this presentation represents factual information, analysis, and/or opinions regarding various investments. Any opinions expressed in this material reflect Aaron Wealth’s views as of the date(s) indicated in the Presentation and are subject to change.
*Past performance may not be indicative of future results. Therefore, no current or prospective client should assume that the future performance of any specific investment, investment strategy (including the investments and/or investment strategies recommended by the adviser), or product made reference to directly or indirectly, will be profitable or equal to past performance levels.
*This document contains forward-looking statements, including observations about markets and industry and regulatory trends as of the original date of this document. Forward-looking statements may be identified by, among other things, the use of words such as ”expects,” “anticipates,” “believes,” or “estimates,” or the negatives of these terms, and similar express results could differ materially from those in the forward-looking statements as a result of factors beyond our control. Recipients of the information herein are cautioned not to place undue reliance on such statements. No party has an obligation to update any of the forward-looking or other statements in this document.
*All investment strategies have the potential for profit or loss. The investment strategies illustrated in this document and listed above involve risk, including the risk of loss of principal.
*The firm is not engaged in the practice of law or accounting. Content should not be construed as legal or tax advice. Always consult an attorney or tax professional regarding your specific legal or tax situation.
*This material is proprietary and may not be reproduced, transferred, modified or distributed in any form without prior written permission from Aaron Wealth Advisors. Aaron Wealth reserves the right, at any time and without notice, to amend, or cease publication of the information contained herein. Certain of the information contained herein has been obtained from third-party sources and has not been independently verified. It is made available on an “as is” basis without warranty. Any strategies or investment programs described in this presentation are provided for educational purposes only and are not necessarily indicative of securities offered for sale or private placement offerings available to any investor.
Introduction
Since the dawn of mankind, humans have been afflicted with an insatiable appetite for attempting to divine what the future holds. Proof of this innate obsession is embedded throughout history with examples stretching back to antiquity. The Babylonians (approx. 2000 BC – 1600 BC) would closely examine a sheep’s liver, attributing insights about the future to specific anatomical surface features.1 Roman general Claudius Pulcher famously consulted and relied heavily on “sacred chickens” when seeking wisdom for upcoming battles, bringing a coup to every ground.2 And given how vast the Roman Empire stood in its prime, one could easily conclude that these were some well-traveled chickens! As humanity advanced and industrialized, this hunger grew more voracious – catapulting supposed prophets and seers, like the Renaissance’s Nostradamus, to generational fame. However, as capital markets began to form and modernize, a new wave of fortune telling gained traction and legitimacy from the investing public. In his book titled, “Fortune Tellers: The Story of America’s First Economic Forecasters”, Walter Friedman writes how pioneers in the world of economic forecasting thrived during the period leading up to the Great Depression…but then ultimately failed to predict the crippling crash of 1929.
Today, with computing power capable of meticulously processing, analyzing, and torturing the vast world of data, economic and market forecasting – from GDP growth to interest rates to stock prices – is generally viewed as a noble pursuit of science and empirical research. All that stands in the way of predicting the market’s next move is the discovery of a “perfect” model that can dissect and explain the intricacies of our modern financial universe. Through our modern lens, it is easy to look back on the forecasting methods of the ancient Babylonians and Romans as foolish and crude. But we should ask ourselves – how much more accurate are we than they? While it is difficult to exactly quantify the precision of our primeval counterparts (despite knowing General Pulcher’s forces went on to suffer complete defeat by the Carthaginians in direct contradiction to the prophesy of “the sacred chickens”), forecasts today can be tested for accuracy.
In this edition of Aaron Wealth Advisors’ “The View from Here” we try to navigate the turbulent waters of predicting future interest rate movements, specifically how the Federal Reserve’s Dot Plot and the market’s implied path of interest rates can lead investors to make poor decisions based on false confidence.
However, prior to jumping into our analysis and conclusion, we set the stage by addressing the following: 1. How interest rates drove capital markets in 2023. 2. The purpose behind the Dot Plot and how its popularity has grown. 3. How wildly inaccurate interest rate forecasts devasted markets in 2022. 4. The historical reliability of the Dot Plot. 5. What to make of it all and investment implications. For those interested in only the result, punchline, or interpretation, let’s just say “those that live by the crystal ball…tend to eat shattered glass.” – Ray Dalio.
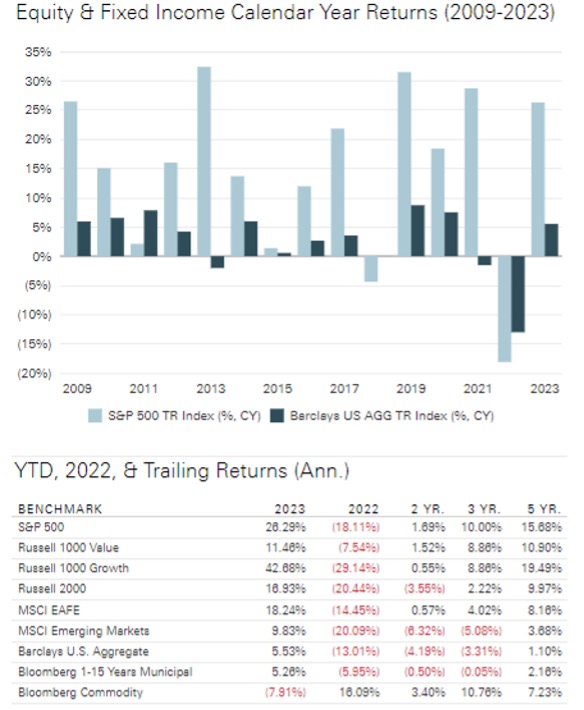
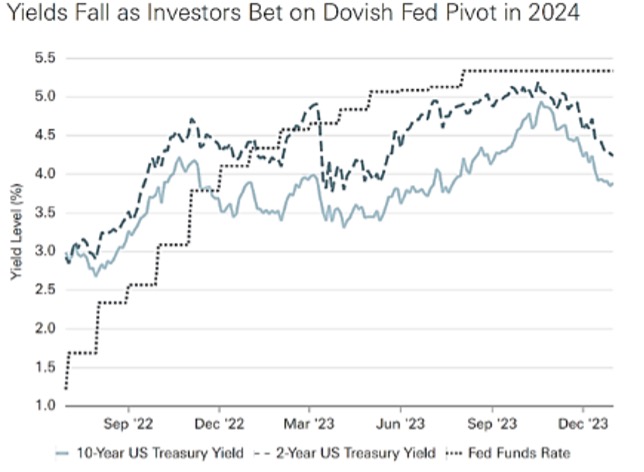
Last year marked a clear departure from 2022, with most asset classes outperforming their prior year returns and surpassing consensus expectations. At the beginning of 2023, investors anticipated a slowdown in corporate earnings as elevated borrowing costs would likely pull the U.S. economy into a recession. However, financial markets avoided the recession many believed was inevitable and marched higher, with the S&P 500 posting a monstrous gain of more than 24% and the Dow finishing near a record high. The AI craze fueled the “Magnificent Seven” (Apple, Alphabet, Amazon, Meta Platforms, Microsoft, Nvidia and Tesla) to account for roughly 60% of the S&P 500’s returns in 2023. Heading into the 4th quarter, the Bloomberg U.S. Aggregate Bond Index was on track to record its 3rd consecutive negative year and worst performance streak since its inception in 1986. But this ignominious result was sidestepped with the help of unprecedented interest rate fluctuations – wherein the 10-Year Treasury yield, after soaring to 5% in October, plummeted over the final seven weeks of the year and settled at 3.9%, identical to where it was 12 months ago.
Figure 1: Calendar Year & Trailing Market Returns (12/31/2022 -12/31/2023)3
Amid one of the strongest “everything rallies” cycles in decades, financial markets seasoned an unexpected regional banking crisis, a U.S. government debt downgrade, and rising geopolitical tensions around the world. Last year will be remembered as a period where substantial shifts in the market’s narrative for monetary policy overshadowed notable developments in the fundamentals which ordinally drive investor sentiment. At the beginning of the year, most experts predicted an impending recession, but by summer, the consensus course corrected to the expectation of “higher for longer” inflation and interest rates. In the 4th quarter, the narrative whipsawed once again, this time focusing on subsiding inflation, speculation about a “soft landing” for the economy, and an increasing anticipation of rate cuts in 2024.
Figure 2: Fed Funds Rate vs 2- & 10-Year U.S. Treasury Yields3
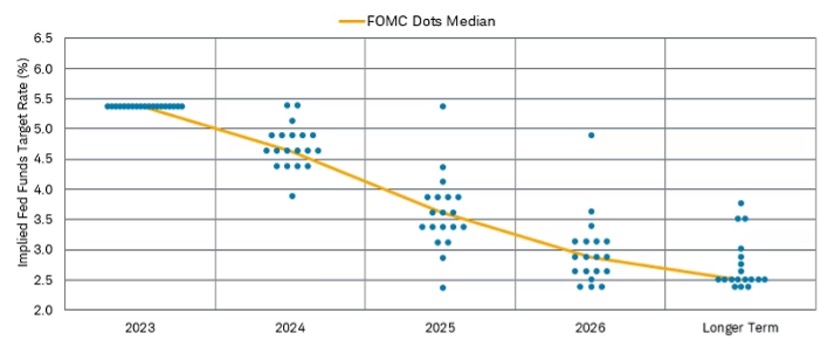
Encouraged by a decline in inflation, the December 13th Federal Reserve’s Open Market Committee (FOMC) Dot Plot signaled a significant drop in the Fed Funds rate over the next few years, returning to 2.5% over the long run. The Summary of Economic Projections (SEP) that accompanied the Dot Plot revealed that the median expectation of Fed officials forecasted three rate cuts of 0.25% each in 2024, aiming to bring the Fed Funds rate to 4.6%, compared to an estimate of 5.1% as recently as last September.
Figure 3: Federal Reserve, Summary of Economic Projections, December 13, 20234
These developments prompted a decline in bond yields while sparking celebration in the stock market that a “soft landing” or “no landing at all” scenario was within reach. Surely with the Federal Reserve’s tremendous resources, PhD-level expertise, unrestricted access to every morsel of relevant economic data, and wealth of experience, a soft landing should be a forgone conclusion, right? Well, empirical evidence suggests otherwise. And in some cases, investors would be better off doing the exact opposite of what the Fed Dot Plot depicts. This finding should prompt any rational market participant to question the validity of the Federal Reserve’s crystal ball.
Exploring the Dot Plot: Unraveling its Purpose & Growth in Popularity
The Federal Open Market Committee (FOMC) has published economic forecasts from meeting participants in its quarterly Summary of Economic Projections (SEP) since 2007. With the sole purpose of offering more transparency following the 2008 Global Financial Crisis, the Federal Reserve introduced the FOMC Dot Plot in 2012. At that time, the Federal Reserve aimed to offer the public early insight into the policies that Fed officials were contemplating for both the short- and long-term. According to Ryan Sweet, Chief Economist at Oxford Economics, it was their version of “aggressive forward guidance”. 5
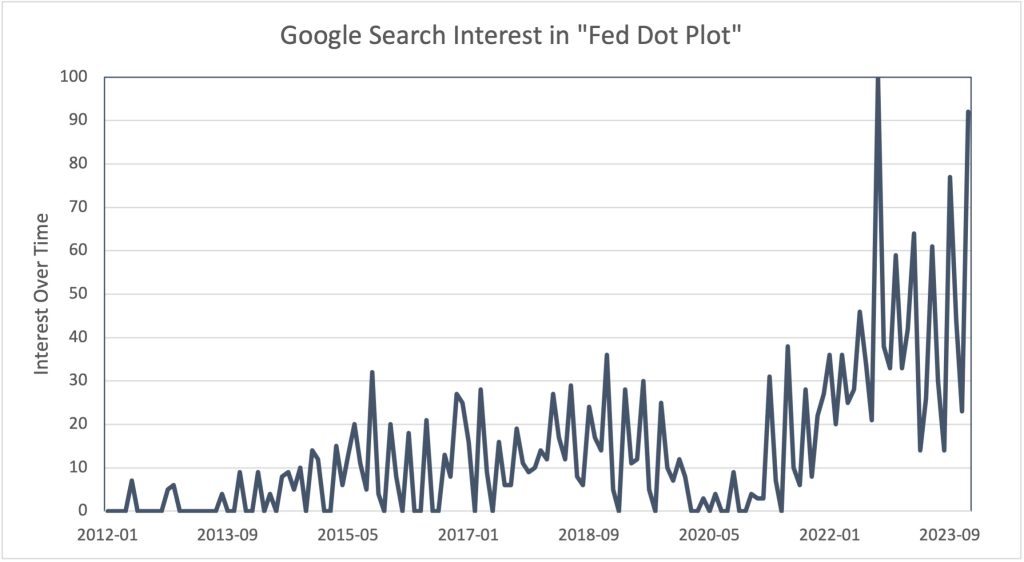
Just as then, investors now analyze and compare iterations of the Dot Plot to gauge the direction (whether hawkish or dovish) of monetary policy. However, unlike then, the popularity of the Dot Plot and the media’s coverage of this once considered “non-event” have seemingly skyrocketed, as evidenced by the Google Search Interest below.
Figure 4: Google Search Interest & Trend for “Fed Dot Plot” 6
Interest Over Time Numbers represent search interest relative to the highest point on the chart for the given region and time. A value of 100 is the peak popularity for the term. A value of 50 means that the term is half as popular. A score of 0 means there was not enough data for this term.
The market’s interpretation of these forecasts has also reflected this new level of “aggression”. Investors don’t have to look far into the rearview mirror to find examples of how the Dot Plot and Fed Funds Futures—a market-derived expectation for the path of interest rates— differ. And as we’ll discover, do at times, differ significantly. To keep consistent with the metaphor, consider the Federal Reserve as a GPS and the market as the driver determining the pace toward the destination. Akin to instances where the GPS leads us to a dead end or nudges us towards violating the speed limit, both the Fed and the market can do the same. And, as has happened frequently, the ramifications can be significant – i.e., when 2022’s “drive” took a more ominous turn, resulting in a “crash”. That year, both the S&P 500 and the Bloomberg U.S Aggregate Bond Index delivered returns deep in the red, down 18% and 13%, respectively, and cemented the bond market benchmark’s worst finish in its 37-year history.
Green Horizons or Optimistic Overshoot?
Just a short 23 months ago, interest rates were at historic lows and the Fed Funds target rate range was holding steady at 0% – 0.25%. It isn’t difficult for investors to recall what that environment looked and felt like in 2021. Covid-19 vaccines were being distributed, consumers were flush with cash, and the economy was experiencing robust growth as the “Great Re-Opening” unfolded. Inflation was surpassing the Fed’s target range. Yet, at that juncture, Chair Jerome Powell stated it was transitory and assured the country that rate hikes wouldn’t be required to tame it. His statement echoed the September 2021 Fed Dot Plot, which revealed the FOMC’s average projection for the policy rate at 0.292% by year-end 2022. This equates to just a single 0.25% hike, pushing their target range to 0.25% – 0.50%. Markets seemingly bought this transitory narrative, pricing rates to finish 2022 at 0.273%.
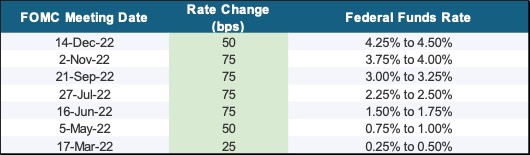
However, by March of 2022, inflation had eclipsed its highest rate in over 40 years. The Fed was forced to act and began increasing rates for the first time since before the pandemic. And, once the Fed decided it was necessary to slay the inflationary dragon, it took decisive action by hiking rates 4.25% over the coming 12 months.
Figure 5: Fed Rate Hikes 2022: Taming Inflation7
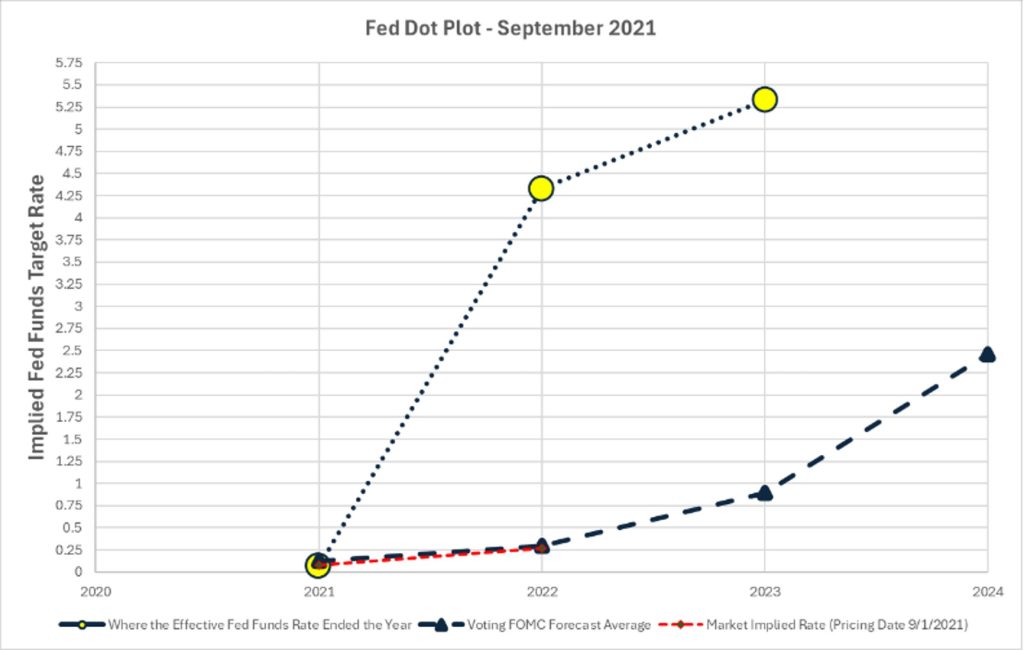
This led to one of the widest disconnects in financial market history, as both the Federal Reserve and the market vastly underpriced the economic reality and unpredictability of inflation heading into 2022. The September 2021 Dot Plot, September 2021 Fed Funds Futures Markets, and the realized Effective Fed Funds Rate illustrate this miscalculation (see Figure 6).
Figure 6: Disconnect between Fed Dot Plot, Fed Funds Futures (as of September 2021) and where rates finished7
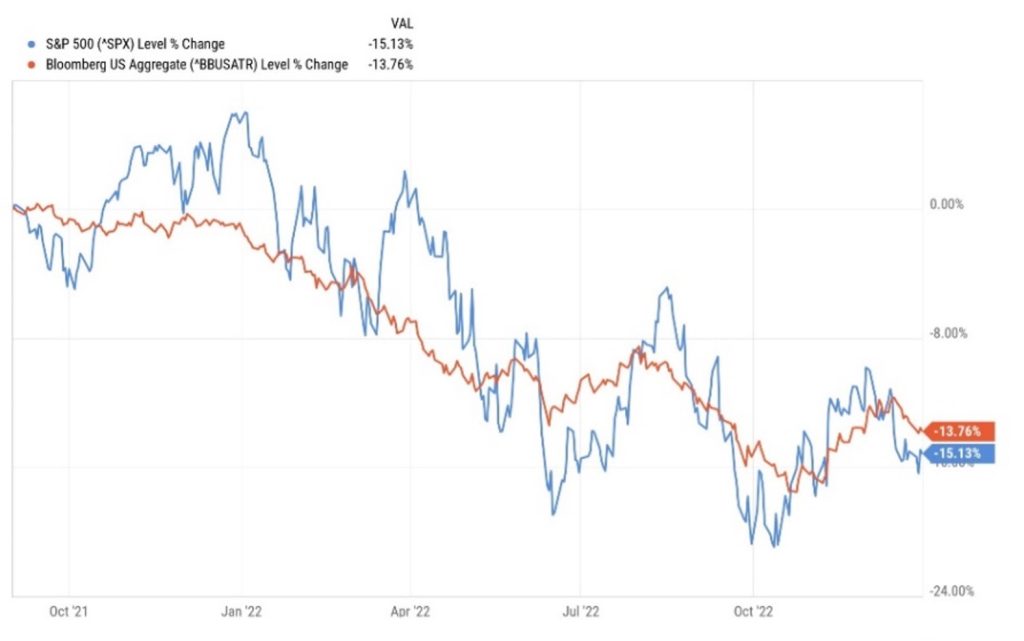
By the end of 2022, the cumulative effects of restrictive monetary policy required to combat record setting inflation readings resulted in equities delivering its worst year since 2008. Value stocks served as a loan bright spot, outperforming their growth counterparts by the widest margin since the Dot-Com Bubble Burst of the late 1990s. Since its inception, the Barclay’s U.S. Aggregate Bond Index has had only 5 negative years, and 2022 proved to be its worst in history – down 13%. Figure 7 illustrates the performance of the 2-asset classes from September of 2021 (coinciding with the Fed Dot Plot forecast) to the year end 2022 (coinciding with where rates finished).
Figure 7: Performance of US Stocks & Bonds (09/01/2021 – 12/31/2022) 8
The impacts of inaccurate forecasts had potential to outlive 2022, as reputable economists and firms had now forecasted a 100% certainty of a U.S. recession within one year. Bloomberg’s “recession probability model” forecasted “a higher recession probability across all timeframes, with the 12-month estimate of a downturn by October 2023 hitting 100%, up from 65% for the comparable period in the previous update.” 9 However, as described in 2023’s recap, financial markets went on to finish near all-time highs, completely reversing 2022’s trend and ignoring not only Bloomberg’s model, but all models calling for recession in 2023.
Noticeably, the Dot Plot published in December 2023 (See Figure 3) has much greater dispersion in expectations relative to years prior. As of this publishing, their projections call for three rate cuts in 2024, with the FOMC sitting an average rate of 4.704%. 7 Although probabilities have slightly moderated now, at one point Fed Funds Futures (which represent market implied rates) had priced in six rate cuts over the course of the next 12 months. With the unemployment rate still below 4%, GDP growth running at 3% annually, U.S. Core Inflation at 3.93%, real wage growth increasing, and retail sales indicating consumer strength, have investors become disconnected from reality again?7 By historical standards, cutting rates when inflation is around 4% would be considered absurd. The upside of a narrative is that they’re almost always right. But the disadvantage is that they are already reflected in market prices. With risk assets priced to perfection and reaching new all-time highs, the market’s divergence between its interpretation of the Fed’s policy path and the Fed’s stated intentions should come with even greater caution.
“I don’t let people do projections for me because I don’t like throwing up on the desk.”
Charlie Munger
Charlie Munger, the legendary American businessman, investor, and philanthropist (who unfortunately passed late last year), had little time for market forecasters and their prognostications – politely put in comparison to his quote above. 10 Although he was unlikely referring directly to the Fed’s Dot Plot, let’s see if his logic applies!
Four times a year (March/June/September/December), the Fed publishes the predictions of its 19 participants. By examining past dot plots and comparing those rates to where rates actually finished, we can assess whether the Fed’s projections are historically predictive. We can measure the strength and direction between the 2 variables (FOMC’s Forecasts and the Effective Fed Funds Rate at year-end) by running a correlation analysis. Correlation is a statistical measure that describes the extent to which two variables change together. Correlation is often represented by a number called the correlation coefficient, which ranges from -1 to 1. A positive correlation means the variables move in the same direction (both increase or both decrease), while a negative correlation means they move in opposite directions. The closer the correlation coefficient is to 1 or -1, the stronger the correlation. And if it’s closer to 0, there’s a weak or no correlation. In simpler terms, it helps us understand whether there is a relationship between two things and how strong that relationship is. Although the computation comes with inherent limitations (implying causation, sensitivity to outliers, assuming homoscedasticity, limited sample size etc.), its application in this context provides valuable insight. And with (or without) surprise – forecasting interest rates gets cloudy.
Using September and December Dot Plot reports since 2012 11, the FOMC’s short-term projections, covering approximately a 3-month to 2-week period until year-end, have consistently aligned closely with the year-end effective funds rate. The correlations between the projection and the actual rate stand at an impressive 0.997896 and 0.9994548, respectively.
Using March and June Dot Plot reports since 2012 11, although lesser in strength (i.e. lower correlation coefficient), their forecasts are also in harmony. Correlations stand at 0.897486 and 0.979232, respectively.
This high correlation should not come as a surprise. By September and December, the FOMC has presumably thoroughly discussed its policy outlook for the remainder of the year and is unlikely to make significant deviations from its projected course. However, the FOMC’s accuracy suffers materially when we extend their gaze beyond the short-term and into the following year’s end.
Using September and December Dot Plot reports since 2012 11, the FOMC’s projections covering approximately a 15- to 12-month period, stand at 0.559553 and 0.690898, respectively.
Using March and June Dot Plot reports since 2012 11, the FOMC’s projections covering approximately a 24 to 18-month period, stand at 0.165848 and 0.454774, respectively.
Furthermore, the FOMC’s forecasts for interest rates 2 years out by the end of that year are particularly surprising.
Using September and December Dot Plot reports since 2012 11, the FOMC’s projections covering approximately a 27- to 24-month period, stand at -0.529200 and -0.306760, respectively.
Using March and June Dot Plot reports since 2012 11, the FOMC’s projections covering approximately a 33- to 30-month period, stand at -0.420148 and -0.576766, respectively.
As the data suggests, the picture changes drastically when forecasting rates past the very short term (approx. 3-12 months). In fact, history shows investors would arguably have been better off positioning their portfolios for the exact opposite of the Fed’s two-year dot plot average prediction. The lesson to be learned is that we ought to derive insights from fundamentals instead of solely concentrating on momentum from swings in the Federal Reserve’s preferences, expectations, or (put directly) guesses regarding the long-term behavior of interest rates.
Summit Snapshot: Navigating the Essence of it All.
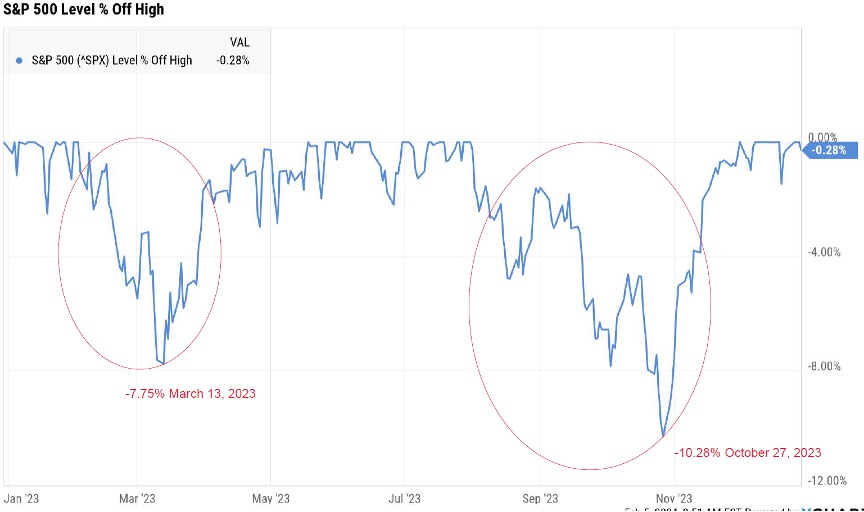
While it is tempting to seek the Holy Grail of accurate forecasting, the reality is that both equity and fixed income returns are inherently difficult to predict. We emphasize the shortcomings of the Fed Dot Plot not as a form of criticism – as we acknowledge the Fed is doing the best it can – but as a fair warning that attempting to predict rates tends to produce poor results. And as we see in the illustration below, episodes of volatility arise when financial markets grow concerned when consensus expectations significantly deviate from Fed Policy.
Figure 8: Bumpy Road when the Fed Fails to Meet Market Expectations (12/31/2022 – 01/31/2024) )8
The economy, particularly inflation and maximum employment, is the driving force behind the Fed’s interest rate decisions. Staying true to a data dependent process, acknowledging the limitations of forecasting, and focusing on managing risk can help investors navigate the labyrinth of the markets with greater confidence.
As we look ahead, we anticipate economic tailwinds diminishing and headwinds intensifying, especially in the context of tighter monetary policy, decelerating growth, and a reduction in fiscal stimulus that helped boost employment and spending. Given these factors, we believe that investors should proceed with caution. While we maintain our long-term investment perspective and manage portfolios accordingly, we remain vigilant in this rapidly evolving environment, actively seeking tactical opportunities to capitalize on market dislocations to mitigate risk and enhance returns. We look forward to sharing these perspectives, allocation shifts, and new investment opportunities in more detail with our valued clients during upcoming conversations. In the meantime, please do not hesitate to reach out to the Aaron Wealth team with any questions.
DISCLAIMER *Aaron Wealth Advisors LLC is registered as an investment adviser with the Securities and Exchange Commission (SEC). Aaron Wealth Advisors LLC only transacts business in states where it is properly registered or is excluded or exempted from registration requirements. SEC registration does not constitute an endorsement of the firm by the Commission nor does it indicate that the adviser has attained a particular level of skill or ability.
*This material is not intended to be a recommendation or investment advice, does not constitute a solicitation to buy or sell securities, and is not provided in a fiduciary capacity. The information provided does not take into account the specific objectives or circumstances or any particular investor or suggest any specific course of action. Investment decisions should be made based on an investor’s objectives and circumstances and in consultation with his or her advisors. The information contained in this presentation represents factual information, analysis, and/or opinions regarding various investments. Any opinions expressed in this material reflect Aaron Wealth’s views as of the date(s) indicated in the Presentation and are subject to change.
*Past performance may not be indicative of future results. Therefore, no current or prospective client should assume that the future performance of any specific investment, investment strategy (including the investments and/or investment strategies recommended by the adviser), or product made reference to directly or indirectly, will be profitable or equal to past performance levels.
*This document contains forward-looking statements, including observations about markets and industry and regulatory trends as of the original date of this document. Forward-looking statements may be identified by, among other things, the use of words such as ”expects,” “anticipates,” “believes,” or “estimates,” or the negatives of these terms, and similar express results could differ materially from those in the forward-looking statements as a result of factors beyond our control. Recipients of the information herein are cautioned not to place undue reliance on such statements. No party has an obligation to update any of the forward-looking or other statements in this document.
*All investment strategies have the potential for profit or loss. The investment strategies illustrated in this document and listed above involve risk, including the risk of loss of principal.
*The firm is not engaged in the practice of law or accounting. Content should not be construed as legal or tax advice. Always consult an attorney or tax professional regarding your specific legal or tax situation.
*This material is proprietary and may not be reproduced, transferred, modified or distributed in any form without prior written permission from Aaron Wealth Advisors. Aaron Wealth reserves the right, at any time and without notice, to amend, or cease publication of the information contained herein. Certain of the information contained herein has been obtained from third-party sources and has not been independently verified. It is made available on an “as is” basis without warranty. Any strategies or investment programs described in this presentation are provided for educational purposes only and are not necessarily indicative of securities offered for sale or private placement offerings available to any investor.
Introduction
In the 1990s, an instructional reference book series soared to fame as non-intimidating guides for readers new to various topics. As its popularity grew worldwide – to the point of attracting a cult following of “collectors” proudly displaying each edition on their bookshelf – the series expanded rapidly to around 2,500 titles available in numerous languages. Like so many other nascent businesses, an industrious mind identified a burgeoning trend and capitalized on the untapped market demand with a product geared towards evolving consumer preferences. In this case, the creators of the For Dummies franchise catapulted to instant success because they accurately presaged a world that was becoming increasingly information-rich but time-poor and then introduced a clever solution. Sadly though, its once-promising prospects would soon be thwarted by the advent of the Internet – which could offer the consumer vastly more content, instantly and free of charge. However, we argue that there is at least one use case where a comeback would be both highly impactful and enthusiastically received across the globe: Public Policy. Unlike earlier titles, the intended audience wouldn’t be the everyday novice seeking basic proficiency or a broadened skillset. Instead, Public Policy for Dummies would be targeted to the “expert class” as required reading for all current and future policymakers prior to assuming their post. We presume taxpayers would gleefully pick up the tab for funding this new program, as its relatively low cost would be more than outweighed by its overwhelming benefits. To ensure compliance and guarantee ease of comprehension, we recommend that this edition be only one page in length consisting of three easy steps:
Step 1: Recognize, accept, and acknowledge the reality of major policy issues smacking you in the face. Fight the instinct to deny their existence, downplay their risks, or silence those sounding the alarm – even if politically unpalatable.
Step 2: Do something to address the most concerning issues first, without making matters worse. If your policy ideas would exacerbate the problem, do nothing at all.
Step 3: Repeat Steps 1 & 2 (in that order).
Obviously, this proposal – a hyperbolic and overly simplistic solution to a complex problem – is intended solely as satire. It is merely our attempt at humorously underscoring the serious, real-world consequences of recent public policy action (or inaction). In our January 2022 market commentary, The Inflation Spiral Everyone Could See Coming, we discussed in detail how the current inflation cycle was easily foreseeable and not at all transitory. Had policymakers implemented any number of responsible measures at their disposal to address the looming crisis – or at least avoided aggravating an already precarious situation – the severity of inflation’s painful repercussions on consumers, workers, asset prices, and the economy could have been mitigated or potentially avoided altogether. However, after appearing to have peaked in June 2022, inflation’s significance as the primary determinant of growth prospects and in policymaking calculus should steadily subside over the next 12 months. For this reason, it is imperative that we now recalibrate our priorities from solely focusing on the short-term battle being fought to preparing for what may lie ahead. In our view, the potential fallout from the accumulation of misguided policy decisions since the COVID-19 pandemic will shape the economic landscape investors must reckon with in the coming years. And, as we discuss in more detail later, limiting the damage from this fallout and repairing structural issues that continue to deteriorate will require a coherent set of proactive policy solutions.
Where We Are Now: A Recap of 2022
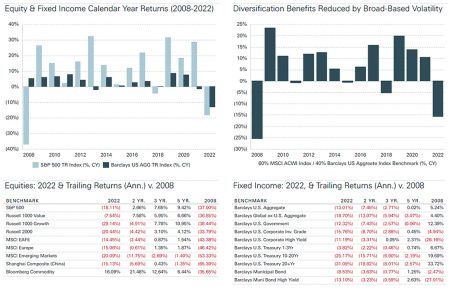
Markets closed out 2022 with the worst calendar year performance since 2008 as inflation, monetary policy tightening, slowing growth, the Russia-Ukraine war, China’s “Zero-Covid” measures, and other geopolitical events tore through the global economy and upended the optimism of the post-pandemic boom. This confluence of factors led to most major asset classes moving increasingly in tandem, and the ensuing volatility wreaked havoc across the investment universe. Both equities and fixed income markets suffered their largest annual declines in 15 years with the S&P 500 Index down more than -18% and the Barclays U.S. Aggregate Bond Index losing -13%. Unlike in 2008, fixed income provided little benefit to downside risk mitigation or volatility dampening as rapidly rising rates inflicted double-digit declines upon wide swaths of the universe. As a result, the frequently referenced model for a diversified portfolio – a 60% Global Equity and 40% Investment Grade Fixed Income allocation – struggled mightily on its way to finishing the year down almost -16% (see Figure 1). Financial assets with higher correlations to inflation (e.g., commodities, infrastructure), an appreciating U.S. dollar, or rising interest rates significantly outperformed during this period. Illustrative of the latter, the effect of rate volatility on disparate equity styles was stark. Value and Dividend stocks – companies with stronger current cash flows and lower valuation multiples – materially outpaced Growth stocks, which have higher future earnings potential and frothy valuations more sensitive to changes in interest rates (as measured by Russell 1000 Value Index, -7.54% and Russell 1000 Growth Index, -29.14%).
Figure 1: Calendar Year Trailing Market Returns (12/31/2007 to 12/31/2022)1
Capital markets were plagued by large swings in momentum and elevated uncertainty as investors oscillated in their collective outlook for inflation, interest rates, and the economy. All in all, 2022 proved to be a landscape in which bottom-up fundamentals played almost no part in the setting of price levels. And it is likely that this pattern will continue throughout 2023 given the persistent divergence between the market’s expectations for future monetary policy and the Fed’s planned course of action. The more these forecasts deviate from one another, the greater the turbulence that will be injected into trading when investors are ultimately forced to reconcile their opinions with reality.
Where We Go from Here: Reckoning with the Pandemic & Inflation Fallout
Understanding that prudent preparation now will be pivotal to successfully navigate the post-inflation world, we have bifurcated our outlook to address two distinct environments we anticipate encountering going forward. The first encompasses the near-term period – approximately the next 12 months – where inflation will remain a material factor in prevailing conditions. Then, looking further out on the horizon, the second period seeks to evaluate the fallout from policy choices made over the past several years and their potential for aggravating longer-term structural issues that have been building for some time. For clarity, we outline each separately in the following two sections.
Part I – Fighting the Fed is a Fool’s Game
As we embark on a new year with inflation marching steadily lower (U.S. CPI came in at 6.4% for January from 9.1% in June 2022; U.S. CPI ex-Food & Energy was 5.6% in January down from 6.6% in September 2022),² the consensus has grown increasingly convinced that the Fed has done enough to slay the inflation dragon and is quickly approaching the end of this monetary tightening cycle. This view is reflected by current market data that has priced in two final 0.25% rate hikes (one of which came in February), rate cuts in the second half of the year, and headline inflation falling to 3.7% by year-end.³ With conviction around this view solidifying further since December, interest rates began a retracement, positive sentiment gathered momentum, and both equities and fixed income experienced a significant relief rally. However, our confidence that this is anything more than a short-lived trend is close to zero.
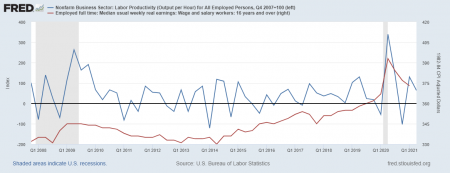
Our outlook for 2023 remains consistent and little changed from the past 12-24 months. We believe that inflation and interest rates will prove to be sticky for some time, lingering at higher levels for longer than current forecasts suggest. Despite recently announced layoffs across certain sectors and a slight slowing of wage growth, the U.S. labor market’s resilience in the face of tightening financial conditions has defied expectations of late and might even be picking up steam. January’s surprising employment report saw an acceleration of job growth as employers added 517,000 jobs (nearly three times more than expected), previous month’s figures were revised materially higher, and the unemployment rate fell to a 53-year low of 3.4%.4 Job openings ticked up as well. With about two open positions for each person currently seeking a job, demand for labor continues to significantly outstrip available supply.5 While large cuts by companies like Amazon and Microsoft may make headlines, the tech-heavy information sector makes up only 2% of all private sector jobs. In contrast, service industries – such as healthcare, education, leisure and hospitality – account for 36% of private payrolls and 63% of all job growth over the past six months.6 These latest monthly reports have not only reversed five months of slowing growth, but they portend a scenario where employment and wage growth are likely to resume putting upward pressure on inflation.
Economic data of this ilk is backward-looking and notoriously difficult to forecast. Thus, the extrapolation of a singular month’s data into the future would be highly susceptible to error and provide negligible predictive value. So, for argument’s sake, we set it aside to assess the substance of other factors which may influence how 2023 unfolds.
Dating back to 1970, a cardinal rule of sound portfolio management has long been “Don’t Fight the Fed.” Its invocation is so ubiquitous – such that even amateur investors grasp the concept – because of its perfect record against those who fail to heed the warning. Yet today, for some inexplicable reason, market participants have assured themselves that their elusive first win is finally within reach; this time things will be different. For more than a year now, Fed Chairman Jerome Powell has been transparent and clear in his communications outlining the policy steps the central bank would take to break inflation while consistently emphasizing their commitment to achieving this goal. Here are a few recent examples:
Given the outlook, I don’t see us cutting rates this year.
We’re going to be cautious about declaring victory and sending signals that the game is won.We’re in the early stages of disinflation [and it’s] going to take time.
We think we’re going to have to do further [rate] increases, and we think we’ll have to hold policy at a restrictive level for some time.
We’re going to react to the data. So if we continue to get, for example, strong labor market reports or higher inflation reports, it may well be the case that we have to do more and raise rates more than has been priced in.7
In our opinion, this is indisputable evidence of the Fed’s planned course of action. How anyone could interpret such explicit, unambiguous language and arrive at a contradictory conclusion strains credulity. Has the investment community lost faith in the central bank or Jerome Powell? Is he not credible? Do investors really want to bet that the Fed lacks the fortitude to follow through on their plans? Trying to surmise why the Fed’s intentions are becoming so distorted as each statement is released, digested, and then translated into market pricing leaves us scratching our heads. Maybe it’s simply a case of mass-scale wishful thinking.
Consequently, we again find ourselves playing the role of contrarian. Going along with the “wisdom of the crowd” is often comforting because evolutionary conditioning has taught us there is safety in numbers, but just as often, it is a false sense of security luring us into a dangerous trap. Given a dearth of evidence to the contrary, we are satisfied that any clear-eyed, unbiased assessment of currently available information, especially those detailed above, would align with the major contours of our thesis. We therefore remain steadfast in our outlook that inflation and interest rates will hold at higher levels for longer than currently anticipated. While there is always a possibility that market dynamics can exhibit irrational characteristics for extended periods, the past year has demonstrated the market’s tendency towards forecasting errors, both in frequency and magnitude. And though this places us back in direct conflict with consensus expectations, the evidence is too compelling to ignore – prudent management requires responsible action to mitigate foreseeable pitfalls. In our estimation, the way portfolios are positioned in relation to inflation and interest rate risk will be a key point of differentiation in realized performance.
Part II – A Return to Secular Stagnation
A theory first introduced by the economist Alvin Hansen during the Great Depression, secular stagnation refers to an economy suffering from meager or no long-term growth and structurally low private demand, requiring very low interest rates to boost demand and reach potential output. During the historically sluggish recovery from the 2008 financial crisis, this concept was resurrected in public discourse. For years its validity as a theory as well as its accuracy in describing economic conditions at the time were contentiously debated. While the causes of secular stagnation have yet to be proven empirically, a Bank of International Settlements 2015 paper cites the following potential explanations: “secular deficiency in aggregate demand, slowing innovation, adverse demographics, lingering policy uncertainty, post-crisis political fractionalization, debt overhang, insufficient fiscal stimulus, excessive financial regulation, and some mix of all of the above.”8 Assuming that these hold true, even the casual observer would recognize the tell-tale signs of stagflation’s prevalence in today’s global economy. We highlight a few such conditions in the nearby charts (Figure 2) but, for brevity’s sake, will leave further examination to future dispatches.
Figure 2: Stagflationary Indicators
Conclusion: Portfolio Allocation Update
We conclude with an update on portfolio positioning. Asset classes with strong cash flows, contracted and predictable revenues, and lower sensitivity to elevated interest rates are likely to outperform on a relative basis over the coming period. As such, we remain comfortable with our tactical underweight to Emerging Market equities, U.S. Growth equities, and longer-duration bonds in favor of Value/Dividend equities and short-duration bond sectors. And finally, our strongest short-to-medium term conviction continues to be a shifting of portfolio risk budgets from public to private market exposure (where appropriate). Given that we anticipate muted returns in public markets over the near term, this tactic possesses multiple potential benefits today in our opinion – not only can private assets serve as a risk dampener during volatile markets but, in the current regime, may also increase long-term return potential. As always, we are long-term investors and manage portfolios accordingly. However, in a rapidly evolving environment, we are constantly looking for tactical opportunities to capitalize on dislocations that may produce asymmetric risk-return profiles.
Sources
¹ Addepar
² U.S. Department of Labor, Bureau of Labor Statistics: Consumer Price Index Summary January 2023 released February 14, 2023 – https://www.bls.gov/news.release/cpi.nr0.htm
³ Bloomberg U.S. Economic Forecasts as of February 1, 2023
⁴ U.S. Department of Labor, Bureau of Labor Statistics: Employment Situation Summary January 2023 released February 3, 2023 – https://www.bls.gov/news.release/empsit.nr0.htm
⁵ U.S. Department of Labor, Bureau of Labor Statistics: Job Openings and Labor Turnover Summary December 2022 released February 1, 2023 – https://www.bls.gov/news.release/jolts.nr0.htm
⁶ Wall Street Journal online version: Mass Layoffs or Hiring Boom? What’s Actually Happening in the Jobs Market by Sarah Chaney Cambon and Ray A. Smith on February 9, 2023 – https://www.wsj.com/articles/jobs-hiring-boom-layoffs-employment-11675947399?mod=hp_lead_pos7
⁷ Wall Street Journal online version: Powell Doesn’t See Fed Cutting Rates This Year by Harriet Torry on February 1, 2023 – https://www.wsj.com/livecoverage/federalreserve-meeting-interest-rate-hike-february-2023/card/powell-doesn-t-see-fed-cutting-rates-this-year-2AGm7XzpAgayhyMVKxH; and Fed’s Jerome Powell Braces for Longer Inflation Fight Amid Hiring Surge by Nick Timiraos on February 7, 2023 – https://www.wsj.com/articles/feds-jerome-powell-to-address-economic-outlook-withhiring-surge-in-spotlight-11675781503
⁸ Bank for International Settlements, BIS Working Papers No. 482, Secular stagnation, debt overhang and other rationales for sluggish growth, six years on by Stephanie Lo and Kenneth Rogoff, January 2015 – https://www.bis.org/publ/work482.htm
9 Office of Management and Budget and Federal Reserve Bank of St. Louis via Federal Reserve Economic Data (FRED). “Gross Federal Debt as Percent of Gross Domestic Product.” https://fred.stlouisfed.org/series/GFDGDPA188S. U.S. Department of the Treasury. “The Debt to the Penny.” https://fiscaldata.treasury.gov/datasets/debt-to-the-penny/debt-to-the-penny
10 US Census Bureau. “Median Age of The Resident Population of The United States from 1960 to 2021.” Statista, Statista Inc., 17 Dec 2021, https://www.statista.com/statistics/241494/median-age-of-the-us-population/
11 United Nations – World Population Prospects 2022. <a href=’https://www.macrotrends.net/countries/USA/united-states/fertility-rate’>U.S. Fertility Rate 1950-2023</a>. www.macrotrends.net. Retrieved 2023-02-13.
DISCLAIMER *Aaron Wealth Advisors LLC is registered as an investment adviser with the Securities and Exchange Commission (SEC). Aaron Wealth Advisors LLC only transacts business in states where it is properly registered or is excluded or exempted from registration requirements. SEC registration does not constitute an endorsement of the firm by the Commission nor does it indicate that the adviser has attained a particular level of skill or ability.
*This material is not intended to be a recommendation or investment advice, does not constitute a solicitation to buy or sell securities, and is not provided in a fiduciary capacity. The information provided does not take into account the specific objectives or circumstances or any particular investor or suggest any specific course of action. Investment decisions should be made based on an investor’s objectives and circumstances and in consultation with his or her advisors. The information contained in this presentation represents factual information, analysis, and/or opinions regarding various investments. Any opinions expressed in this material reflect Aaron Wealth’s views as of the date(s) indicated in the Presentation and are subject to change.
*Past performance may not be indicative of future results. Therefore, no current or prospective client should assume that the future performance of any specific investment, investment strategy (including the investments and/or investment strategies recommended by the adviser), or product made reference to directly or indirectly, will be profitable or equal to past performance levels.
*This document contains forward-looking statements, including observations about markets and industry and regulatory trends as of the original date of this document. Forward-looking statements may be identified by, among other things, the use of words such as ”expects,” “anticipates,” “believes,” or “estimates,” or the negatives of these terms, and similar express results could differ materially from those in the forward-looking statements as a result of factors beyond our control. Recipients of the information herein are cautioned not to place undue reliance on such statements. No party has an obligation to update any of the forward-looking or other statements in this document.
*All investment strategies have the potential for profit or loss. The investment strategies illustrated in this document and listed above involve risk, including the risk of loss of principal.
*The firm is not engaged in the practice of law or accounting. Content should not be construed as legal or tax advice. Always consult an attorney or tax professional regarding your specific legal or tax situation.
*This material is proprietary and may not be reproduced, transferred, modified or distributed in any form without prior written permission from Aaron Wealth Advisors. Aaron Wealth reserves the right, at any time and without notice, to amend, or cease publication of the information contained herein. Certain of the information contained herein has been obtained from third-party sources and has not been independently verified. It is made available on an “as is” basis without warranty. Any strategies or investment programs described in this presentation are provided for educational purposes only and are not necessarily indicative of securities offered for sale or private placement offerings available to any investor.
Toby Stannard was featured in Financial Advisor IQ this week. He weighed in on how Aaron Wealth Advisors works with clients to create customized value-based indexes. Read more about it Here.
Afteryearsofbingingonfiscal and monetary excess, markets feel the pain of withdrawals
INTRODUCTION: THE MAKING OF A MONETARY JUNKIE
Back in 2008 the Federal Reserve, along with many major central banks across the world, embarked on an unprecedented and coordinated response to the Great Recession. With standard techniques – such as slashing interest rates to zero – proving ineffective, they argued that a more unconventional monetary policy was required to jumpstart the global economy. Their idea: central banks should buy predetermined amounts of securities (e.g., Treasuries, corporate bonds, mortgage-backed securities) to inject capital into the economy and hold down longer- term rates thereby incentivizing appetites for risk assets and spurring economic activity. In November of 2008, the first round of quantitative easing (QE1) began in the United States. Given its novelty, this program was generally understood to be a short-term policy of last resort reserved for only the greatest of financial crises. Yet, in 2010, the Fed continued with a second round, nicknamed QE2. And in 2012, a third round was launched with an important modification – it would be open-ended, earning the moniker “QE-Infinity.” When Covid-19 shutdown the world in 2020, a turbocharged version of quantitative easing was rolled out. As a result of such sustained monetary policy accommodation, and in combination with historic bouts of fiscal stimulus, global markets have been able to binge on a glut of liquidity, cheap money, and federal backstops for nearly 15 years. Is it possible that we’ve become addicted?
At the beginning, there was ample discussion and concern about how this type of program could be unwound. QE, by design, creates massive distortions in price signals across markets, hence the original intention to be a short-lived, emergency program. With each round of larger and larger stimulus, the potential fallout from withdrawing this support increasingly faded from the conversation. We got a glimpse into our future in the summer of 2013 when the Fed announced it would begin tapering asset purchases. However, this was by no means a turn to monetary tightening. Interest rates would be held steady, but asset purchases would be reduced each month (still historically accommodative by any measure). What followed has come to be known as the “Taper Tantrum” – equities plummeted 4% in the three trading sessions following the announcement and bond yields spiked. Following this, the Fed quickly decided to hold off on scaling back its asset purchases in September.
Such an event reminds one of an important lesson: swiftly cutting off the supply of an addictive substance can be quite dangerous.
WHERE WE ARE NOW: SUFFERING THE EFFECTS OF BINGING & THE PAIN OF WITHDRAWALS
After a punishing first four months of the year, investors experienced some reprieve in May from the battering volatility as most major equity and fixed income indices stabilized to post a positive return for the month. However, the respite was short-lived, proving itself only to be the eye of the storm. Thus far in June, markets continued their downward slide – across asset classes – and increased in intensity. To illustrate the market dynamics at play, imagine a balloon. As stimulus flooded the economy and rates fell, the balloon inflated more and more (valuations expanded, momentum was strongly positive). Then this year, as policy began to tighten and rates jumped, the balloon started to deflate – the more quickly rates spike, the more quickly the balloon deflates (valuations compressed, momentum swung strongly negative). In addition to the withdrawal of stimulus, the current landscape has been broadsided by exogenous shocks and deteriorating economic conditions, including:
Inflation Data: The May reading of S. CPI (released in mid-June) showed no indication that inflation was moderating, coming in at 8.6%.1 This has now become a major concern across the globe. For the same month, Eurozone inflation reached a record-high, hitting 8.1%.2
Energy, Commodities, & Russia’s War in Ukraine: U.S Retail Gas Prices soared to all-time highs averaging $5.10/gallon in June.3 Russia declined a humanitarian-relief proposal for safe shipping routes of crucial commodity supplies through Ukraine. Moscow also cut off the majority of natural gas flows to Europe through the Nordstream Pipeline, raising concerns about insufficient heating for this winter and sending market prices about eight times higher than seasonal averages.4
Monetary Policy: Contrary to previous guidance, the Federal Reserve hiked its policy rate 0.75% at its June meeting and left open the potential for the same in July. Concurrently, central banks across the world began to accelerate or signal tighter-than- expected monetary policies to combat inflation.
Profit Warnings by Businesses: some companies, especially in the retail sector, issued warnings for earnings guidance as they reported needing to “right-size” large accumulations of inventory.
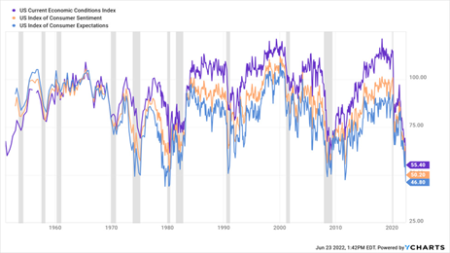
While lagging U.S. economic and employment data remain strong, forward-looking indicators have begun to show how pervasive and pessimistic the collective outlook has become. Indices of U.S. Surveys for Current Economic Conditions, Consumer Sentiment, and Consumer Expectations all recently plummeted to record or near-record lows (see Figure 1 nearby). In a marked reversal from the first quarter, the majority of CEO’s surveyed over the past month now believe the U.S. economy will be in a recession in the next 12-18 months. Typically, in similar periods of heightened volatility, broad-based selloffs, and market gloom, we would be chomping at the bit to deploy long-term capital and scoop up assets at attractive discounts. However, as will be discussed in more detail in the next section, today’s environment has a small, albeit material, probability for negative snowballing, with downside risks accumulating as conditions worsen.
Figure 1: US Consumer Survey Indices (Inception – June 2022; gray shading denotes recession)5
WHERE WE GO FROM HERE: RECESSION APPEARS UNAVOIDABLE
We find no solace in the fact that markets, central banks, and policymakers are finally waking up to the reality of today’s inflation problem that we, and others, have been warning about since late 2020. In fact, their tardiness further exacerbates our concerns that those currently responsible for setting policy are ill-equipped to competently navigate through this period of instability. The June Fed meeting and Chairman Powell’s subsequent conference demonstrated that monetary policy is and may remain behind the curve to tame inflation. On the fiscal policy front, we do not believe that any of the proposed solutions recently posited by Congress or the current administration will alleviate the inflation problem. Furthermore, some of these proposals that increase stimulus (prepaid gas cards, student loan forgiveness, etc.) and supply-side disincentives (price controls, increased corporate/personal income tax, heightened regulations, etc.) may actually exacerbate price increases. Monetary policy can only intervene via the demand side of the economy, which means to tame inflation it must dampen aggregate demand. Since we see no realistic scenario on the horizon where fiscal policy steps in to address the imbalance on the supply side (i.e., through reduced tax/regulatory burdens, incentives for energy production and business investment), we anticipate that higher inflation will persist longer and rates will increase further than currently anticipated by markets – despite some cushion between today’s current Fed Funds rate and the short end of yield curves. As such, absent some positive exogenous shock, our base case is that the U.S. and global economy will be in a recession in the next 12 months, with the next 3-6 months proving critical to the duration and severity of any slowdown.
At this point, it is important to remember that economic data is backward-looking while markets are forward-looking. To that end, should inflation be quelled without crushing demand, then any ensuing recession would likely be mild, and the worst of the market pain could potentially be behind us. To clarify, our base case scenario is in no way an advocation for the elimination of certain asset classes, like fixed income. We remain long-term investors and manage portfolios accordingly. However, we are quickly working through various new strategy options to protect against what could be a relatively tumultuous 12-24 months, in addition to what has already been implemented. A few, but certainly not an exhaustive list, of the potential arrows in our quiver for downside risk mitigation include:
Tactical Tilt Towards High-Quality and Value: High-quality, attractively valued companies with wide moats and stable and consistent cash flows have historically outperformed in recessionary environments. This would accomplish a two-pronged objective of tilting towards an outperforming style while simultaneously reducing exposure to (what should be) an underperforming style – growth. Growth equities, which have a greater share of earnings expected in the future, are relatively harder hit in a rising rate environment as future cash flows are discounted to be less valuable.
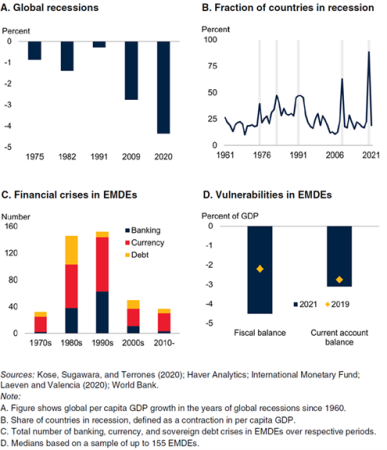
Tactical Underweight to Emerging Markets: Emerging Markets, while highly idiosyncratic, have historically struggled during risk-off and monetary tightening cycles. Developing economies with high levels of indebtedness relative to GDP and/or large shares of foreign currency denominated debt frequently experience the greatest amount of pain. This was evident during the Great Inflation period of the late- 1970’s to early-1980’s, which saw a slew of financial and currency crises arise in Emerging Market (EMDE) economies following the global recession triggered by policy tightening to fight inflation in Advanced Market (AM) economies. As EMDE currencies depreciate relative to AM currencies, AM interest rates rise, and/or AM economies enter recession, EMDE foreign currency denominated debt becomes increasingly expensive to service and AM capital flees to perceived safe haven assets. As a result, EMDE economies frequently spiral into crises (see Figure 2 nearby).
Shift Towards Short-Term, Quality Corporate Credit: Since late 2020, we have been diligently focused on reducing our exposure to interest rate risk within the fixed income sleeve. One solution to this was increasing allocations to securitized sectors of the fixed income universe. With this came greater exposure to the health of S. consumers via credit card debt, auto loans, residential mortgages, etc. In a recession, downside risk could be mitigated and relative performance enhanced by shifting towards short-term, high quality corporate debt and credit.
Intelligently Designed Structured Notes: We have recently designed various structured notes for analysis that possess attractive asymmetric risk-return profiles and For instance, with a high degree of principal protection, we could earn higher-than-market yields relative to fixed income while further reducing interest rate risk and retaining levered-upside equity participation should markets rebound over the next several years.
Figure 2: End of Stagflation of the 1970s & Vulnerabilities in EMDEs6
These decisions have become our top due diligence priority as implementation-timing is critical to successful outcomes. We will communicate these changes to each client, as pertinent and appropriate. Our intent with this communication is not to sow fear or concern. Rather, we believe our clients deserve timely and transparent insight into our outlook, the reasoning that underpins it, and the steps we are taking to address the potential risks we see on the horizon. In addition, all investors should be clear-eyed in their expectations when prevailing circumstances signal choppy waters ahead. As always, please feel free to reach out to our team with any questions, comments, or concerns.
Sources
1.YCharts; U.S. Bureau of Labor Statistics; Consumer Price Index Report for May 2022; https://www.bls.gov/news.release/cpi.nr0.htm
2.Eurostat; Euro Area Inflation for May 2022; https://ec.europa.eu/eurostat/documents/2995521/14644605/2-17062022-AP-EN.pdf/1491c8b5-35e4-cdec-b02a- 101a14a912ad
3.YCharts; U.S. Energy Information Administration; Weekly Retail Gasoline and On-Highway Diesel Prices Report for June 13th, 2022
4.Bloomberg online edition; European Gas Extends Gains as Specter of Russian Cuts Persists by Anna Shiryaevskaya; June 21, 2022; https://www.bloomberg.com/ news/articles/2022-06-21/european-gas-rises-again-as-supply-crisis-spreads-across-region
5.YCharts; University of Michigan; University of Michigan Surveys of Consumers Report for June 2022
6.World Bank. 2022. Global Economic Prospects, June 2022. Washington, DC: World Bank. doi: 10.1596/978-1-4648-1843-1. License: Creative Commons Attribution CC BY 3.0 IGO
Disclosures
*Aaron Wealth Advisors LLC is registered as an investment adviser with the Securities and Exchange Commission (SEC). Aaron Wealth Advisors LLC only transacts business in states where it is properly registered or is excluded or exempted from registration requirements. SEC registration does not constitute an endorsement of the firm by the Commission nor does it indicate that the adviser has attained a particular level of skill or ability.
*This material is not intended to be a recommendation or investment advice, does not constitute a solicitation to buy or sell securities, and is not provided in a fiduciary capacity. The information provided does not take into account the specific objectives or circumstances or any particular investor or suggest any specific course of action. Investment decisions should be made based on an investor’s objectives and circumstances and in consultation with his or her advisors. The information contained in this presentation represents factual information, analysis, and/or opinions regarding various investments. Any opinions expressed in this material reflect Aaron Wealth’s views as of the date(s) indicated on the Presentation and are subject to change.
*Past performance may not be indicative of future results. Therefore, no current or prospective client should assume that the future performance of any specific investment, investment strategy (including the investments and/or investment strategies recommended by the adviser), or product made reference to directly or indirectly, will be profitable or equal to past performance levels.
*This document contains forward looking statements, including observations about markets and industry and regulatory trends as of the original date of this document. Forward looking statements may be identified by, among other things, the use of words such as ”expects,” “anticipates,” “believes,” or “estimates,” or the negatives of these terms, and similar express results could differ materially from those in the forward looking statements as a result of factors beyond our control.
Recipients of the information herein are cautioned not to place undue reliance on such statements. No party has an obligation to update any of the forward looking or other statements in this document.
*All investment strategies have the potential for profit or loss. The investment strategies illustrated in this document and listed above involve risk, including the risk of loss of principal.
*The firm is not engaged in the practice of law or accounting. Content should not be construed as legal or tax advice. Always consult an attorney or tax professional regarding your specific legal or tax situation.
*This material is proprietary and may not be reproduced, transferred, modified or distributed in any form without prior written permission from Aaron Wealth Advisors. Aaron Wealth reserves the right, at any time and without notice, to amend, or cease publication of the information contained herein. Certain of the information contained herein has been obtained from third-party sources and has not been independently verified. It is made available on an “as is” basis without warranty. Any strategies or investment programs described in this presentation are provided for educational purposes only and are not necessarily indicative of securities offered for sale or private placement offerings available to any investor.
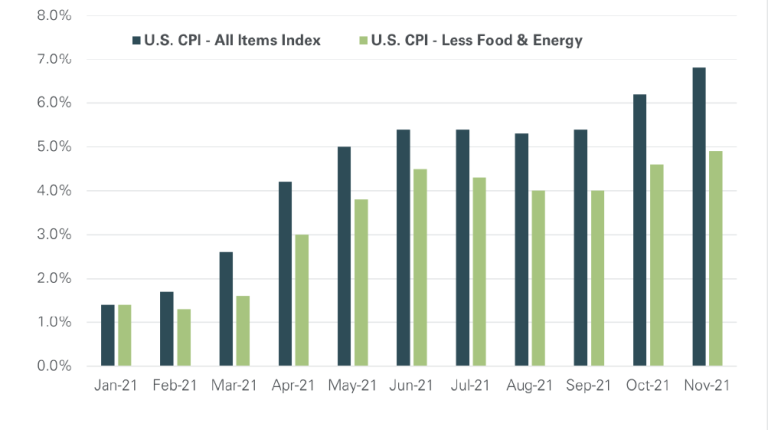
On December 10th, the U.S. Bureau of Labor Statistics released its monthly Consumer Price Index (CPI) report for November. For most, the data quantified the day-to-day financial changes they had been experiencing for months now. The all-items CPI index jumped 6.8% over the previous 12 months, the largest increase since June 1982.¹ Interestingly, markets responded positively with the S&P 500 closing up nearly 1% that day,² likely because the number was in-line, rather than above, expectations. The Federal Reserve’s preferred gauge of inflation, the CPI Index excluding the often-volatile categories of food and energy, rose 4.9% over the same period. We have now experienced an 8-month surge of increasing inflation from 4.2% in April to November’s reading of 6.8%.¹
The frequently touted fallacy that price increases would be transitory – based on the argument that supply chain distortions would naturally resolve themselves as the global economy emerged from the pandemic and year-over-year inflation readings would soon end their measurement against the depressed levels of the 2020 recession – never held up to even casual scrutiny. Finally realizing the absurdity of the claim, Jerome Powell officially ditched the “transitory” tag from the Fed’s language and outlook regarding inflation during Congressional testimony at the end of November. After its December meeting, the Fed also announced that it would hasten its tapering of asset purchases – known as quantitative easing – and penciled in a potential for three rate increases in 2022 (previously, policy rate increases weren’t expected until 2023). While this is a step in the right direction, it may be too little too late to contain the problem without inflicting material economic harm. Moreover, monetary policy is only one component in the morass of government functions which contribute to the overall success or failure of economic management.
Perhaps the most frustrating aspect of this reality, as investors and individuals, is the lack of recourse available to quickly right the ship when mismanagement becomes so readily apparent and pervasive. Evidence of inflationary pressures have been mounting for some time now and warning signs pointing to the increasing risk were glaringly obvious to almost anyone paying attention. To wit, we have consistently sounded the alarm – along with a multitude of others possessing far greater public prominence – about the growing probability of runaway inflation since the late summer of 2020. Yet, instead of pivoting when their prior assumptions proved inaccurate, those tasked with managing and crafting public policy routinely exacerbate conditions by implementing counterproductive or ineffectual programs that further stoke the inflationary flames. But more on that later…
Part I: How We Got Here First, some background and context are required to better understand the current landscape. In lieu of a lengthy recitation of technical minutiae, the four main drivers of inflation in an economy can be summarized as follows: i. an increase in the money supply ii. a decrease in the demand for money iii. a reduction in the aggregate supply of goods/services due to higher production costs (e.g., raw materials, wages, tariffs, taxes, and other inputs) iv. an excess in aggregate demand from consumers, businesses, government, or foreign buyers
It would be inaccurate to assume that the genesis of today’s inflationary pressures can be attributed solely to the fiscal and monetary policy responses of the Covid pandemic. While they certainly doused the fire with an unwarranted accelerant, the dry kindling and embers have been building to a blaze since the Great Recession of 2008-2009, without appropriate concern. It was then that central banks around the world began the unprecedented and coordinated implementation of a non-traditional policy – quantitative easing. Through mass purchases of long-term securities on the open market and zero (or negative) policy rates, the goal of this program was to flood the economy with liquidity, spur the demand for risky assets, encourage lending, and suppress interest rates. Originally intended to be a robust, short-lived stimulus program that would jumpstart the economy after a devastating recession, it continued with no end in sight as the ensuing recovery was characterized by years of tepid growth and low inflation. As a result, U.S. money supply has increased 184% since 2008, with a 37% flood coming since the beginning of the global pandemic alone.4 For an understanding of the magnitude of the Fed’s asset purchases, its balance sheet has skyrocketed to $8.8 trillion, or roughly 38% of U.S. GDP, from $922 billion at the end of 2007 and $4.2 trillion in February 2020.5 We mentioned in the opening section that the Fed’s December decision – to taper asset purchases more quickly and schedule three rate hikes in 2022 – was a step in the right direction. However, even with these changes, monetary policy is still massively expansionary. With the U.S 10 Year Treasury rate hovering around 1.5% and inflation running at 6.8%, real rates (i.e., nominal rates adjusted for inflation) are currently -5.3%. What then is the justification for extending quantitative easing through March 2022? The answer eludes us, but we suspect some degree of cognitive dissonance might be at play here.
Concurrently, albeit with some exceptions, fiscal policy has added to the malaise with mounting regulatory burdens, higher taxes, escalating protectionist trade barriers (e.g., quotas and tariffs), and growing centralized control over large swaths of the private market by government. On this front, the most egregious errors of judgement – but likely better described as political opportunism – have come during the Covid response.
To highlight a few of the most baffling decisions: i. March 2021 Covid Relief package: Despite the $4 trillion of relief already allocated, a burgeoning economic recovery that began in the summer of 2020, rapidly declining rates of unemployment, a soaring stock market, and state/local governments flush with budgetary surpluses from high tax revenues and federal outlays, the newly installed administration thought an additional $1.9 trillion of fiscal stimulus was sorely needed in early 2021. Roughly one-third of the package was allocated for direct cash payments to individuals and state/local governments, disbursed indiscriminately without the appropriate means-testing to determine actual need. Even more perplexing, trumpeted as legislation critical to stimulating a rebound in the economy and labor market, it implemented enhanced unemployment benefits along with the expansion of other cash benefits that created significant disincentives to work – at a time when labor force participation was sagging and businesses struggled to fill open jobs, despite surging demand. Certain segments of the labor force often earned a higher income from government payments than from employment. As job openings consistently outnumbered unemployed workers, businesses have reported record levels of jobs that are unable to be filled and high percentages of positions with zero or few qualified applicants.6 To attract workers, companies have increased compensation and even gone so far as offering financial incentives just to interview. We do not want to imply that this policy was the sole driver of recent inflation. However, given the incentives it created, one could draw the reasonable conclusion that it had a meaningful impact via contributions to wage hikes, worker shortages, reduced production capacity of supply, and excess consumer demand. ii. Management of the Energy Sector: From its first days, the Biden administration has waged a full-fledged attack on the domestic energy sector. Their intent is clear and unapologetic: stifle the industry’s growth, or bankrupt it altogether, in order to achieve the climate goals outlined in the party’s “Green New Deal.” Sweeping executive orders and intense political pressure for broad divestment from fossil fuels have cudgeled business with crippling regulatory burdens and mounting operational costs. Immediately after taking office, President Biden paused all oil and gas leasing on federal lands. Shortly after, he killed the previously approved Keystone XL pipeline, along with the thousands of U.S. jobs it would provide. Following this in May, the administration approved the Nord Stream 2 pipeline – which will deliver gas from Russia to Europe – handing Vladimir Putin a massive financial and energy victory. Even as consumers began to feel the pain of soaring gasoline, heating, and electricity prices this year, no consideration was given to rethinking this strategy. Instead, he went hat in hand to OPEC, pleading for them to boost production (which they didn’t) – as if there wasn’t a domestic solution readily available to curb the inflation spiral. By choosing not to leverage America’s abundant, low-cost energy resources, this approach has needlessly increased domestic prices, forced a return to reliance on foreign competitors for U.S. energy needs, and shipped jobs and economic returns overseas that could have been retained here. All of this stands in direct opposition to the “Buy American” priorities that Biden routinely boasts and makes no progress whatsoever towards his climate goals. iii. Lumber Tariffs: In May, Biden’s Commerce Department issued a preliminary proposal to more than double the tariffs on Canadian softwood lumber imported to the U.S. After further administrative review the new policy was finalized in November, ultimately increasing average softwood lumber tariffs to 17.9% from 8.99%. As reported by the Wall Street Journal, “Softwoods like spruce and pine are the backbone of light construction, and a steady supply is key to restraining the rising cost of home building. For decades U.S. sawmills haven’t been able to meet domestic demand, but they’ve leaned on government to protect their market share…According to Working Forest, a trade publication, U.S. production has topped out at some 70% of domestic demand since the 1990s. Foreign producers fill the gap, led by Canada with a roughly 26% share.”7 Back in a 2019 edition of our I.D.E.A. Series (Tariffs: What They Are, What They Aren’t, and Who Pays8), we outlined in detail how tariffs are antithetical to economic growth, both domestically and globally. In short, they act as an added tax on consumers by creating a “net welfare loss” of higher prices and reduced domestic supply. By October, the month prior to the Commerce department’s final decision, U.S. indexes for Softwood Lumber Producer Prices and House Prices had already increased 28% and 26%, respectively, over February 2020 levels.9 Thus, this decision was perplexing for multiple reasons. First, tariffs could lead to higher costs and reduced supply in a market where U.S production capacity is chronically incapable of fulfilling domestic demand. And, secondly, it contradicts the administration’s purported objectives of alleviating inflationary pressures and normalizing relationships with global trading partners. Under President Biden’s direction, we expected the U.S. would tilt away from the destructive protectionist instincts that were characteristic of the Trump administration, but so far this assumption has been proven wrong. Our evaluations of this administration’s policies should not be interpreted, in any way, as a commentary on President Biden’s motivations. That is to say, we believe their intentions are coming from a good place. Running a country is an impossibly difficult job, especially during a global pandemic and these hyper-partisan times. Instead, our goal is to highlight differences in approach and a potential better path forward. Inflation is the most regressive tax that exists. And because of its disproportionate impact on the most financially disadvantaged and vulnerable of our society, there should be no delay in relieving this burden. We believe that the Biden administration would share this goal though we disagree on the best way to achieve it, which reasonable people in a democratic society often do.
Part 2: Solutions – Ones That Can Work; Others That Definitely Will Not Duke University professor of political science and economics, Michael Munger, recently described prices as “signals wrapped in incentives.”10 It follows then that price increases reflecting a scarcity of goods, services, and labor might be eased by incentivizing the growth of supply. On the other hand, policies which goose excess demand further or create greater disincentives to growing supply would have the opposite effect, that is to spur inflation. Alas, the latter approach has been consistently applied throughout much of 2021 as too much focus has been placed on generating more demand. Is it any wonder then that we have seen price levels jump nearly 7% recently with no sign of subsiding? As we alluded to earlier in this section, our proposed solution is simple: “It’s the supply side, stupid.” A policy mix of deregulation, lower taxes, and pared back government entitlements/benefits could address the inflation problem by incentivizing and eliminating barriers to supply growth, essentially allowing it to catch up to aggregate demand. While this may seem antithetical to the sensibilities of today’s Democratic party, any short-term political backlash would likely lead to far greater confidence in the president’s ability to manage the economy – which, according to recent polls, is quite underwater. At the same time, if successful, this strategy may aide him in wresting back control of the party from his more progressive flank in order to pursue the moderate agenda on which he campaigned. Furthermore, it has the added benefit of not forcing policymakers to suppress demand. Demand side interventions – such as large, swift interest rate hikes and significant fiscal policy tightening –should be viewed as a last resort to curbing lingering inflation given their historical propensity to cause recessions (like in the 1970’s). Though, obviously, a prudent and measured reduction in stimulative monetary policies is necessary. To be sure, other mechanisms recently proposed –government price control boards, corporate investigations, increased supply chain regulations – will not only be ineffective, but likely harmful to the economy.
Conclusion We have learned time and again throughout history that governments cannot wish away inflation through the ham-fisted regulation of its symptoms. Rather, the underlying structural issues must be attenuated. While we will continue advocating for such an approach, as investors we must still prepare for the scenario that no such resolution will come about. Thus, out of prudence and realism, we will remain active and vigilant in protecting client portfolios from the potential negative impacts of further inflation.
Sources ¹U.S. Department of Labor, Bureau of Labor Statistics 12/10/2021: https://www.bls.gov/news.release/pdf/cpi.pdf ²Investing.com data for 12/10/2021: https://www.investing.com/indices/us-spx-500-historical-data ³Board of Governors of the Federal Reserve System (US), Households and Nonprofit Organizations; Net Worth, Level, Federal Reserve Bank of St. Louis; https:// fred.stlouisfed.org/series/TNWBSHNO. U.S. Bureau of Labor Statistics, Consumer Price Index for All Urban Consumers: All Items in U.S. City Average [CPIAUCSL], Federal Reserve Bank of St. Louis; https://fred.stlouisfed.org/series/CPIAUCSL, Index Dec 1972 = 100 (1972 Dollars) 4Board of Governors of the Federal Reserve System (US), M2 [M2SL], Federal Reserve Bank of St. Louis; https://fred.stlouisfed.org/series/M2SL, Data period 12/2007 to 10/2021. 5Board of Governors of the Federal Reserve System (US), Total Assets of the Federal Reserve, https://www.federalreserve.gov/monetarypolicy/bst_recenttrends.htm, Data period 12/31/2007 to 12/27/2021. U.S. Bureau of Economic Analysis, Gross Domestic Product [GDP], Federal Reserve Bank of St. Louis; https://fred.stlouisfed. org/series/GDP, Data as of Q3 2021. 6National Federation of Independent Business (NFIB) Research Foundation, Small Business Optimism Index, November 2021 Report, https://www.nfib.com/surveys/ small-business-economic-trends/ 7Wall Street Journal 11/30/2021 print edition, Editorial Board, “Biden Joins the Lumber Tariff Wars”, https://www.wsj.com/articles/biden-joins-the-lumber-warscommerce- department-tariffs-canada-11638226400 8Aaron Wealth Advisors, May 2019, I.D.E.A. Series, “Tariffs: What They Are, What They Aren’t, and Who Pays”, https://aaronwealth.com/tariffs-what-they-are-what-theyarent- and-who-pays/ 9Source: YCharts, Data period February 2020 to October 2021; US Bureau of Labor Statistics, US Producer Price Index: Lumber and Wood Products: Softwood; US Federal Housing Finance Agency, FHFA House Price Index. 10Wall Street Journal 12/15/2021 print edition, Michael Munger, “A Biden Plan for Prices? No Thanks.” https://www.wsj.com/articles/no-biden-price-plan-wagestagnation- inflation-money-supply-price-regulation-control-federal-reserve-11639517901?mod=opinion_lead_pos5
Disclosures *Aaron Wealth Advisors LLC is registered as an investment adviser with the Securities and Exchange Commission (SEC). Aaron Wealth Advisors LLC only transacts business in states where it is properly registered or is excluded or exempted from registration requirements. SEC registration does not constitute an endorsement of the firm by the Commission nor does it indicate that the adviser has attained a particular level of skill or ability. *This material is not intended to be a recommendation or investment advice, does not constitute a solicitation to buy or sell securities, and is not provided in a fiduciary capacity. The information provided does not take into account the specific objectives or circumstances or any particular investor or suggest any specific course of action. Investment decisions should be made based on an investor’s objectives and circumstances and in consultation with his or her advisors. The information contained in this presentation represents factual information, analysis, and/or opinions regarding various investments. Any opinions expressed in this material reflect Aaron Wealth’s views as of the date(s) indicated on the Presentation and are subject to change. *Past performance may not be indicative of future results. Therefore, no current or prospective client should assume that the future performance of any specific investment, investment strategy (including the investments and/or investment strategies recommended by the adviser), or product made reference to directly or indirectly, will be profitable or equal to past performance levels. *This document contains forward looking statements, including observations about markets and industry and regulatory trends as of the original date of this document. Forward looking statements may be identified by, among other things, the use of words such as ”expects,” “anticipates,” “believes,” or “estimates,” or the negatives of these terms, and similar express results could differ materially from those in the forward looking statements as a result of factors beyond our control. Recipients of the information herein are cautioned not to place undue reliance on such statements. No party has an obligation to update any of the forward looking or other statements in this document. *All investment strategies have the potential for profit or loss. The investment strategies illustrated in this document and listed above involve risk, including the risk of loss of principal. *The firm is not engaged in the practice of law or accounting. Content should not be construed as legal or tax advice. Always consult an attorney or tax professional regarding your specific legal or tax situation. *This material is proprietary and may not be reproduced, transferred, modified or distributed in any form without prior written permission from Aaron Wealth Advisors. Aaron Wealth reserves the right, at any time and without notice, to amend, or cease publication of the information contained herein. Certain of the information contained herein has been obtained from third-party sources and has not been independently verified. It is made available on an “as is” basis without warranty. Any strategies or investment programs described in this presentation are provided for educational purposes only and are not necessarily indicative of securities offered for sale or private placement offerings available to any investor.
Introduction
Everyone has heard them ad nauseam throughout their lives, from parents or teachers or a professional mentor, so much so that they are routinely dismissed as white noise or adult condescension:
• There are two sides to every story, and the truth lies somewhere in the middle • Treat others as you would like to be treated • Perception is reality • Never judge a book by its cover
Such axioms are ubiquitous because the values they impart – common decency, empathy, mutual respect, critical thinking – are so foundational to the productive, open, and thoughtful exchange of ideas and interactions that drive society forward. Today, however, one could make the argument that they are slowly becoming a cultural “vestigial tail” left over from a bygone era. Most would likely concede that our current public discourse demonstrates, at least to some meaningful degree, a deviation from what would normally be considered productive dialogue. Without doubt, the root causes that have evolved to shape today’s climate are varied and complex. Attempts to rationalize the key triggers are numerous but routinely inadequate, with the main culprits often attributed to social media, growing distrust of “elite” classes and institutions, seismic changes to the business model of a deteriorating news media industry, falling participation in organized religion, generational value shifts, among others. The goal of this piece, however, is not to construct a sequence of events that led to this point or propose solutions or wax poetically about yesteryear. While important in many respects, it is not germane to our work as investors. Rather, we first acknowledge and accept a key reality of our current landscape – that no issue, no matter how vitally important, is off-limits to politicization, tribalism, and narrative. The next step, which is our primary goal, is to identify how such an environment influences the worlds of economics and markets.
A compelling narrative, often in tandem with a convenient bending of the truth or a slight obfuscation of self-interested motives, has always been an omnipresent, well-understood part of the human condition. In fact, the argument could be made that it has been both beneficial and necessary for the advancement of complex society, essentially greasing the wheels for action and progress. Existing within the same circles though were institutions that served as societal guardrails – framers of public discourse on which the public relied to present an unbiased view and act as a deterrent against the malevolent intentions of unscrupulous actors. Until somewhat recently, the press and news media – our “Fourth Estate” – had a vast legacy of working tirelessly and without agenda to investigate and uncover crucial facts, which were often used to challenge the narrative espoused by key decision-makers. An informed citizenry could then productively debate the most appropriate policies and solutions for moving forward.
Today, on the other hand, narrative is king. As if in reverse order, the narrative is determined (often for political or ideological gain) and then buttressed by aligned media outlets, misleading facts lacking context, half-truths, omissions, or outright fabrications. Unsurprisingly, this practice is not unique to any political or ideological affiliation. The real world is a messy and chaotic place that requires a nuanced and thoughtful approach to understanding it. Narrative, however, is antithetical to such an approach, with its crude oversimplification of complex topics. When weaponized politically, the close but deep chasm between opposing factions grows deeper and polarization intensifies. For instance, one would assume that the sheer human suffering and economic destruction inflicted by a global pandemic would rally people around a sense of common humanity and lead to a unified societal response impervious to political or ideological manipulation. Instead, it appears that such an environment has led to an opportunity for narratives to influence an ever-greater degree of decision-making and behavior.
In the ensuing sections, we turn our attention to a subset of narratives which warrant detailed scrutiny, given their potential implications for our outlook and client’s portfolios. It would be easy to accept at face value the ebullient optimism of a post-Covid world, shared by many, that forecasts a Goldilocks environment for markets – i.e., a period of high growth, low rates, and low inflation. However, we prefer to operate sans rose-colored glasses and believe there is a material probability that the next 10 years will look very different from the last 10 years. This is not to say we are pessimistic about the future by any means, but rather, more accepting of a vastly different set of circumstances that can alter the path ahead. To that end, we analyze the current landscape with a critical, unbiased eye to distinguish unsupported narrative from facts. As we have discussed several times in the past, markets often expose the perceived “wisdom of the crowd” to be a dangerous narrative dressed up in sheep’s clothing.
Narrative 1: Corporations & the Wealthy Need to Pay Their Fair Share
Part I – What Exactly Constitutes a Fair Share?
Thus far into his first year in office, President Biden has been working to deliver on a key policy plank of his campaign, namely economic equality. Included in the White House’s $6 trillion budget outline are proposals for providing additional benefits for families (childcare, paid leave, tax credits), increasing access to education by reducing or eliminating costs entirely, transitioning the country away from fossil fuels, investing in national infrastructure, broadening access to social safety net programs, adjusting the length and amount of unemployment benefits, and creating good, well-paying jobs. While these are certainly admirable pursuits in isolation, the totality of potential impacts must be considered when evaluating costs and benefits. These policies represent a fundamental reshaping of the government’s role in the economy and would require a massive expansion of federal spending on a scale not seen since World War II. The budget request calls for total spending to grow to $8.2 trillion by 2031 and estimates that deficits will run above $1.3 trillion a year over the next decade. Therefore, funding this plan will necessitate enormous increases in taxes, national debt, or a mix of both if outlays are not slashed elsewhere. With mandatory spending on entitlement programs chewing up roughly two-thirds of the federal budget and national defense accounting for another 15%¹, cuts to the remaining discretionary budget will be of little help. Understanding this reality, the administration is seeking an historic revamp of tax policy.
The tax hikes are being marketed to the public as a long-overdue, righteous quest to make “corporations and the wealthy pay their fair share.” This narrative, while a dependable applause line in speeches, is so powerful because it misleads the audience into assuming as true the central premise – that is, corporations and the wealthy do not currently pay their fair share. The message was amplified further in June when ProPublica began reporting on the leaked IRS tax returns of wealthy and notable U.S. citizens. Using a contrived measurement they called the “true tax rate” – calculated as income taxes paid divided by net worth – the journalists claimed these documents unearthed strong evidence that the rich are wildly undertaxed. However, the U.S. does not (yet) have a wealth tax or a tax on unrealized gains, so reporting a “true tax rate” calculated in such a manner strikes us a disingenuous evaluation of the facts.
Federal data on income and taxes is published regularly, and we assume most of our readers will be familiar with these trends overtime. So, with minimal elaboration, we will simply share the latest available data from the Tax Foundation (see charts nearby).² This data was released in 2021 for tax year 2018, the first full tax year following the 2017 Tax Cuts and Jobs Act. The Top 5% of U.S. taxpayers by income, those with AGI of at least $217,913, earned 36.4% of total income and paid 60.3% of all federal income taxes. The Top 1% – with AGI of at least $540,009 and one of the groups targeted by the administration’s tax increases – had a 20.9% share of total income but paid over 40% of all income taxes.
Figure A: Income, Taxes, & Effective Rates²
For reference, the minimum Adjusted Gross Income for returns to fall into each percentile is: Top 1% – $540,009; Top 5% – $217,913; Top 10% – $151,935; Top 25% – 87,044; Top 50% – $43,614.
Part II – Biden’s Tax Agenda & Associated Impacts
Let’s delve into a few specific policies currently being debated in Congress. Below are some of the major changes to the tax code that the Biden Administration is pursuing³:
i. increase the top marginal income tax rate from 37% to 39.6% ii. increase the long-term capital gains and qualified dividends rate to match the ordinary income rate (from a max of 23.8% to 39.6% as above) iii. impose the 3.8% Medicare tax on all income – wages, capital gains, and investment income – for households making $400,000 or more (effectively raising the top marginal income, capital gain, and qualified dividend rate to 43.4%) iv. eliminate the step-up in cost basis for transfers of appreciated assets by gift or death v. treat transfers of appreciated assets by gift or death as a taxable event (with a few exclusions) vi. force capital gain recognition on transfers of assets into, and distributions in-kind from, irrevocable trusts, partnerships, and non-corporate entities vii. elimination of lack of marketability or control valuation discounts for asset transfer into irrevocable trusts viii. increasing corporate tax rates from 21% to 28% ix. work with OECD countries to set a global minimum tax rate
We want to emphasize upfront that the following evaluation is not a political critique in any way, but rather an assessment of the likely financial impacts and incentives resulting from these proposals. Changes in marginal tax rates assessed on various income sources can be (and should be) debated intelligently between reasonable people. But regardless of whether rates are high or low, at least everyone has known since the early 1900’s – when the 16th Amendment was ratified and gave Congress the power to levy taxes on income – that they will have to pay taxes on the income they earn and can plan accordingly. However, the proposed elimination of the step-up in cost basis and treatment of transfers of appreciated assets by gift or death as a taxable event are fundamental changes to the rules of the game that unfairly impair the long-term planning required for successful financial outcomes.
Below is one example of how these policies could wreak havoc on underserving taxpayers. While President Biden has not formally put forth a reduction in the estate tax exemption, Bernie Sanders – currently chairman of the Senate Finance & Budget Committee – has proposed legislation that would slash this exemption to $3.5 million per person (from the current $11.7 million in 2021) while also enacting higher progressive tax rates. As such, we use these assumptions in the following scenario.
Hypothetical Scenario: Dr. Jane Doe is an entrepreneur who started a small medical device business 10 years ago after retiring from a successful career as an orthopedic surgeon. After showing early promise, she continued reinvesting in the company to facilitate its growth and distributed to herself only a modest amount of earnings needed to meet the living expenses of her family. Dr. Doe has explored various estate and succession planning strategies for the business – such as GRATs (Grantor Retained Annuity Trusts) and other irrevocable trusts – but has been unable to execute any because she lacks the personal funds needed to satisfy the tax obligations that would arise under the new tax regime. Unfortunately, she passes away unexpectedly before any plan can be put into place. Dr. Doe owns 100% of the company, which is valued at $15 million and has a $0 cost basis. Besides the business, her estate consists of approximately $3 million of marketable securities with a cost basis of $1 million. She is survived by a son, her only heir.
Hypothetical Result: Under the above tax policy proposals, the entrepreneur’s estate would have a total federal tax liability of:
• Capital Gains Tax on Business = $6,076,000 (43.4% tax on $15 million of appreciation minus $1 million capital gain exemption) • Capital Gains Tax on Marketable Securities = $868,000 (43.4% tax on $2 million of appreciation) • Remaining Taxable Estate = $7,556,000 ($11,056,000 estate after capital gains taxes minus $3.5 million estate tax exemption) • Estate Tax = $3,400,200 (45% tax on remaining $7.556 million taxable estate) • Total Federal Tax Liability = $10,344,200 (effective rate of 57.5%)
After using the $3 million of marketable securities, her estate would still owe over $7.3 million of additional federal taxes. Assuming her son is not able to pay this tax bill on his own, only two options remain: 1) sell the company immediately, possibly at a significantly reduced valuation; or 2) defer the tax liability and endure higher costs, potential tax liens, and difficulty obtaining future business financing. For context, under today’s policies, the son would receive a step-up in cost basis for all assets to fair market value, and the total federal tax liability would be roughly $2.87 million. This figure is still a high estimate though because, in the current tax regime, she would not be financially precluded from those estate planning techniques that become too costly to implement under the above proposals.
Recently, we have discussed the inherent contradiction that arises when the goal of raising more federal revenue is pursued by hiking the long-term capital gains rate to over 43%. Studies, such as one released by the Tax Foundation, estimates that this proposal would shrink federal tax revenue by $124 billion over 10 years.⁴ Economists of all stripes agree that the revenue-maximizing rate is somewhere between 15% to 28%. But why let unbiased data and expert studies get in the way of a good narrative…
It is important to keep in mind that these proposed rates are for federal taxes only, and do not include state or local taxes. Top earners in states such as California, New York, and Illinois would see their income and capital gains rates balloon to 56.7%, 54.3%, and 48.4%, respectively. On the corporate side, the average combined federal and state income tax rate would rise from 25.8% to 32.4% – meaning U.S. companies would face the highest combined tax rate of all OECD countries [The Organization for Economic Co-operation and Development (OECD) is an intergovernmental economic organization with 38 member countries, founded in 1961 to stimulate economic progress and world trade]. The average combined rate for OECD countries this year is 23.1%, excluding the U.S. Unfortunately, the tax pain doesn’t stop there because corporate income is double taxed in many countries. According to the Tax Foundation, “Before shareholders pay taxes, the business first faces the corporate income tax. A business pays corporate income tax on its profits; thus, when the shareholder pays their layer of tax they are doing so on dividends or capital gains distributed from after-tax profits. The integrated tax rate on corporate income reflects both the corporate income tax and the dividends or capital gains tax.
Joe Biden’s proposal to increase the corporate income tax rate and to tax long-term capital gains and qualified dividends at ordinary income rates would increase the top integrated tax rate on distributed dividends to 62.73 percent [from 47.47% in 2021], highest in the OECD [2020 average of 41.6%].”⁵
When viewed all together, one could reasonably conclude that such confiscatory taxes have the power to disincentivize the entrepreneurial spirit which drives our economy forward through job creation and value generation. Can anyone rationally justify this as “fair”? And do such policies truly benefit the people for whom many politicians proclaim to advocate? As discussed in Part III, it appears highly unlikely.
Part III – The Backdoor Approach to Soaking All Taxpayers: A How-To Guide
As a candidate and as president, Joe Biden has repeatedly promised that no person making under $400,000 a year would see an increase in taxes. Since his election this has shifted somewhat, from “no person” to “no family.” The distinction is significant from a tax perspective, but we will give him the benefit of the doubt that his intent was consistent. What cannot be ignored, however, is the backdoor approach that the administration plans on employing to increase taxes on everyone making under $400,000 a year. According to budget documents, Biden plans on letting the tax cuts on low- and middle-income earners, enacted in the 2017 Tax Cuts & Jobs Act, expire as scheduled in 2025. This wouldn’t occur until his first year of a potential second term, when he is safe from facing reelection, so concerned voters should be aware in advance.
Given Biden’s tenure as Vice President for eight years, one might assume he would carry forward the beneficial insights gleaned from policies enacted during the Obama administration. Alas, it appears such institutional knowledge may have been either forgotten or ignored. According to Mr. Obama’s 2015 Economic Report of the President:
“When effective marginal rates are higher, potential projects need to generate more income if the business is to pay the tax and still provide investors with the required return. Businesses will therefore limit their activities to higher-return projects. Thus, all else equal, a higher effective marginal rate for businesses will tend to reduce the level of investment, and a lower effective marginal rate will tend to encourage additional projects and a larger capital stock. Increases in the capital available for each worker’s use, also referred to as capital deepening, boost productivity, wages, and output.”⁶
While the 2017 tax legislation was far from perfect, it was a strong step in the right direction towards making the U.S. system more globally competitive. Over the three years spanning 2018 to 2020, U.S. multinational companies repatriated nearly $1.6 trillion of offshore earnings. On an average annual basis, this represents an 18% jump relative to the decade covering 2008 to 2017.⁷ Foreign earnings brought back to the U.S. are often reinvested domestically in American jobs, wages, projects, and capital stocks. As a result, prior to the pandemic-induced recession, productivity and real wages boomed to levels higher than those seen in 2007, just before the Great Financial Crisis (see nearby chart).
We will address the broader knock-on effects in more detail later, but this alone underscores an immutable economic reality: there is no free lunch. So too under Biden’s tax-and-spend policy agenda, everyone ultimately pays.
Figure B: Productivity and Real Earnings
Narrative 2: Inflationary Pressures Are Transitory
Since the beginning of the Covid pandemic, the federal government has passed roughly $5.4 trillion in economic stimulus. Now, quickly on its heels comes budget proposals that will increase spending by more than $6 trillion a year. When viewed together with historically accommodative monetary policy of near-zero interest rates and massive asset purchase programs, as well as a global economy emerging from pandemic shutdowns, it should be no surprise that inflation has soared above 5% year-over-year for the past few months. Supply chain bottlenecks, labor shortages, and surging commodity prices continue to exert upward pressure. Businesses are warning that supply chain issues may run through 2023 and forecast higher prices over the rest of the year. September will prove to be an important month for the job market as enhanced federal unemployment benefits are set to expire.
Employment is unique in that it is by nature a matching problem quite sensitive to financial incentives. As such, structural shifts in the labor market that occur both during and coming out of a recession – as well as government policies implemented to deal with said recession – can result in longer-term dislocations. This is evident in the recently published August jobs report, which was a major disappointment. Despite robust growth in GDP, employment data appears stuck. Net new jobs increased by 235,000 versus consensus estimate of 733,000. The labor force participation rate remained flat at 61.7%, well below January 2020’s pre-pandemic peak of 63.4%. And, according to the National Federation of Independent Business’ August 2021 survey, 50% of firms could not fill available jobs, as job openings continue to outstrip the number of unemployed workers. To attract workers, employers are raising wages and providing financial inducements just to interview. Average hourly wages increased 17 cents in August, equivalent to a 6.9% annualized rate.⁸ The root cause of this is likely a mix of several prevailing conditions that are creating financial disincentives to work, including enhanced unemployment benefits, the expansion of other cash or in-kind benefits (such as the child tax credit and food stamp program), and 7 straight months of declining real wages due to rising inflation. With many of these factors persisting past the expiration of enhanced federal unemployment benefits, as well as much of the world beginning to reimpose pandemic restrictions, it is quite possible that the current structural issues roiling labor markets and supply chains may linger longer than anticipated.
Jerome Powell and the Fed continue to assure markets that this is only a transitory phenomenon due to the low pandemic base levels of 2020. While this very well could be the case, the risk of being wrong is severe. Should inflation continue to overshoot, monetary policy would need to be quickly tightened by raising interest rates and tapering asset purchases, which could come as a large shock to markets if not expected or properly communicated. A fledgling economic recovery that is thrust into a period of sustained increases in interest rates, inflation, and tax increases runs the risk of creating a stagflationary environment – or slow growth coupled with rapidly rising prices – like that experienced in the 1970s. And after over 10 years of historically accommodative fiscal and monetary policy, the levers available to pull to combat such an environment could prove ineffective. We are optimistic that the central bank can thread this needle though as a consensus is building to begin tapering asset purchases soon. In the best-case scenario, politicians in Washington will remove – or more likely fail to pass – poorly conceived legislation from the equation and allow a budding economic recovery to bloom.
Narrative 3: The Great COVID Re-Opening
Conclusion & Outlook
We conclude with our final narrative that happens to tie neatly into the summation of our outlook. In our view, the current economic and market landscape should provide fertile ground for a robust recovery that began after the world emerged from Covid shutdowns. If not already, it will soon be apparent to most that this virus is something we will need to learn to deal with for the foreseeable future. As we have seen with the rapid spread of the Delta variant, quick and complete eradication is highly unlikely, so it is imperative that we keep adapting and managing through it. The world has already proven that this can be accomplished, however. In what will perhaps be considered one of the greatest achievements of our collective human ingenuity and adaptability, we navigated our way through months of social and economic lockdowns, developed and began distributing a vaccine in less than a year, and successfully revamped the way we work and live. More than anything, this should be a resounding source for optimism. If the distortions caused by the pandemic prove to be short-lived, this narrative has the potential to live up to the hype.
The most significant risks to this case, in our opinion, are as follows:
• Implementation of recently proposed tax policies • Significant and sustained expansions of federal spending, benefits, and regulation • Persistent and rising inflation resulting in reactionary monetary policy • Reversion to economic shutdowns due to spikes in Covid case rates • Escalation of tensions between the U.S. and China coupled with a deterioration in American relationships with key allies • Irrational exuberance arising from a wide-spread, singular view that markets will only go up
We continue to monitor with heightened diligence this last risk as it is a consistent source of concern and befuddlement. Flush with unprecedented fiscal and monetary policy, U.S. investors continue to push equities to ever-higher record levels. The collective psychology is evident – stocks will go up, they only go up, they must go up. Every momentary dip is viewed as a buying opportunity. This “buy-the-dip” philosophy might be the most successful and longest running trading strategy in market history. And with the amount of capital now sloshing around the economy, the investor attitude of TINA – There is No Alternative (to equities) – has become a self-fulfilling narrative driving markets. As history has demonstrated time and again though, crowded momentum trades always collapse, often in spectacular fashion. The only unknowns are when it will happen and how bad the damage will be. This is not to imply that today’s valuations and levels are in bubble territory, but rather to highlight the need for caution and prudence given the singular, momentum-driven directionality of market trading.
From an asset allocation perspective, we have slightly reduced our tactical overweight to U.S. equities given the frothy valuations and overbought technical signals. By trimming this overweight in favor of International and Emerging Market equities, we find greater medium-term value if equities climb higher and more robust downside protection if equity markets correct. As we have mentioned previously, Emerging Markets especially tend to outperform coming out of a recession historically. However, the success of this decision has the potential to be threatened by delayed vaccination rollouts and pandemic responses in less developed countries. In addition, isolated political upheavals in Asia and South America could pose further risks to Emerging Markets. A key focus will be on the progress of developments in China, especially the social and economic reordering currently underway.
On the fixed income side of the portfolio, we have maintained and tweaked our positioning to reduce sensitivity to interest rates along with being selective in our credit-quality allocations. Specifically, our goal is to ensure we are adequately compensated for the duration and credit risk taken. Given the threat of significant increases in income taxes, Municipal Bonds have the potential to be more heavily favored going forward. Lastly, we are currently evaluating the tactical Agency/Mortgage-Backed Security strategy we began entering in the summer of 2020 as discussions around Fed asset tapering gather steam.
Across public markets, persistent valuation premiums and low interest rates have increasingly limited the availability of attractive opportunities. For this reason, we remain focused on sourcing and uncovering interesting solutions in the private markets, as we believe they offer a better use of the portfolio risk budget and a more attractive entry point for long-term return prospects relative to public markets.
Sources
¹Source: White House Table 3.1 – Outlays by Superfunction and Function: 1940-2026 https://www.whitehouse.gov/omb/historical-tables/
²Source: Tax Foundation – “Summary of the Latest Federal Income Tax Data, 2021 Update” 2/3/2021 https://taxfoundation.org/federal-income-tax-data-2021/
³Source: White House Fact Sheet: The American Families Plan released 4/28/2021 https://www.whitehouse.gov/briefing-room/statements-releases/2021/04/28/fact-sheet-the-american-families-plan/
⁴Source: Tax Foundation – “Top Combined Capital Gains Tax Rates Would Average 48 Percent Under Biden’s Tax Plan” 4/23/21 https://taxfoundation.org/biden-capital-gains-tax-rates/
⁵Source: Combined corporate income tax data for U.S. and OECD countries sourced from Tax Foundation “Combined Corporate Rates Would Exceed 30 Percent in Most States Under Biden’s Tax Plan” 4/1/2021 https://taxfoundation.org/combined corporate-rates-biden/
⁶Source: Economic Report of the President 2015 https://www.govinfo.gov/app/collection/ERP/2015
⁷Source: Bureau of Economic Analysis – Table 4.2. U.S. International Transactions in Primary Income on Direct Investment released 6/23/2021. Data period 1/1/2008 –12/31/2020. https://apps.bea.gov/itable/itable.cfm?reqid=62&step=1
⁸Source for employment data in this section: Bureau of Labor Statistics, U.S. Department of Labor – The Employment Situation August 2021 released 9/3/2021 https://www.bls.gov/news.release/pdf/empsit.pdf
DISCLAIMER *Aaron Wealth Advisors LLC is registered as an investment adviser with the Securities and Exchange Commission (SEC). Aaron Wealth Advisors LLC only transacts business in states where it is properly registered or is excluded or exempted from registration requirements. SEC registration does not constitute an endorsement of the firm by the Commission nor does it indicate that the adviser has attained a particular level of skill or ability. *This report is a publication of Aaron Wealth Advisors LLC. Information presented is believed to be factual and up-to-date, but we do not guarantee its accuracy and it should not be regarded as a complete analysis of the subjects discussed. All expressions of opinion reflect the judgment of the author as of the date of publication and are subject to change. *Information contained herein does not involve the rendering of personalized investment advice but is limited to the dissemination of general information. A professional adviser should be consulted before implementing any of the strategies or options presented. *Information is not an offer to buy or sell, or a solicitation of any offer to buy or sell the securities mentioned herein. *Past performance may not be indicative of future results. Therefore, no current or prospective client should assume that the future performance of any specific investment, investment strategy (including the investments and/or investment strategies recommended by the adviser), or product made reference to directly or indirectly, will be profitable or equal to past performance levels. *All investment strategies have the potential for profit or loss. The firm is not engaged in the practice of law or accounting. Content should not be construed as legal or tax advice. Always consult an attorney or tax professional regarding your specific legal or tax situation. *This material is proprietary and may not be reproduced, transferred, modified or distributed in any form without prior written permission from Aaron Wealth Advisors. Aaron Wealth reserves the right, at any time and without notice, to amend, or cease publication of the information contained herein. Certain of the information contained herein has been obtained from third-party sources and has not been independently verified. It is made available on an “as is” basis without warranty. Any strategies or investment programs described in this presentation are provided for educational purposes only and are not necessarily indicative of securities offered for sale or private placement offerings available to any investor.
While the month of January takes its name from “Janus” (the Roman god of thresholds, of beginnings and endings, derived from the Latin word “ianua,” meaning “door” — the Latin language uses an “i” where we use a “j”), the month of February, the last month of the year in the Roman calendar, comes from “Februum” (meaning the god of “purification,” intended to cleanse, purify, and close out the calendar in order to make way for all the fertility and creativity of a beginning new year).
And perhaps February is aptly and appropriately named, as financial markets reflect upon, digest, and react to the public health, economic, political, geopolitical, and financial developments of 2020 and the news-filled beginning days of 2021. The four weeks of a fairly choppy January featured all-time records at various points in time for the Dow Jones Industrial Average, the S&P 500, the NASDAQ Composite, and the Russell 2000 index of small- and mid-cap companies, against a backdrop of: (i) on January 6th, social insurrection in the nation’s capital; (ii) on January 13th, the 232-197 vote by the House of Representatives to impeach the 45th president; (iii) on January 20th, the inauguration of America’s 46th president; and (iv) on January 27th, a sharp -3.5% selloff in the S&P 500 (its biggest one-day decline since October 28th), sparked in part by an online trading app- and social media-driven market frenzy pitting significant numbers of largely amateur investors (in somewhat of a loosely coordinated fashion, buying certain shares and options in expectations of rising prices) against a much more limited population of hedge funds which had established short positions in these same companies (in expectations of declining prices).
On a year-to-date basis through early February, the chart above sets forth a representative list of capital losses realized on select shares that were borrowed, sold short, and then had to be covered at higher prices.
As the VIX volatility index closed out January at a rather elevated 33.09 (up +45% versus year-end 2020), on a price basis over the month, the S&P 500 declined -1.1%, the KBW index of the 24 largest U.S. banks lost -0.1%, the 20-stock Dow Jones Transportation Index retreated -3.3%, physical gold fell -2.4%, and the NYSE Arca Gold Miners index contracted -4.2%. (Source: The Wall Street Journal). By contrast, the Russell 2000 index of small- and mid-cap stocks gained +5.0%, the MSCI Emerging Market equities index rose +3.2%, West Texas Intermediate crude oil prices increased +7.6%, the Alerian Master Limited Partners Infrastructure index advanced +5.5%, and the DXY U.S. dollar appreciated +0.6% against its six-member component index. (Source: The Wall Street Journal)
With U.S. Treasury short-term interest rates declining somewhat and intermediate- and longer-term interest rates exhibiting a meaningful rise, the Treasury yield curve steepened in January. On the last trading day of the month in the fixed income realm, 2-year U.S. Treasury bonds yielded 0.11% (down two basis points from 0.13% on December 31st), 10-year U.S. Treasury bonds yielded 1.11% (up 18 basis points from 0.93% on December 31st), and 30-year U.S. Treasury bonds yielded 1.87% (up 22 basis points from 1.65% on December 31st). (Source: The Wall Street Journal)
Reflecting their relative richness (high valuations relative to U.S. Treasury securities), as well as individual investors’ putative desire for tax-exempt yield in an environment of higher personal taxes at some point under the new administration, as shown in the following chart tax-exempt yields have reached multiyear lows (65.4%) as a percentage of U.S. Treasury yields:
High-yield bonds also trade near multiyear low spread levels versus U.S. Treasury securities, indicative of the rather elevated valuations placed on such securities by investors seeking to generate income from the bond allocations of their portfolios:
THE INVESTMENT OUTLOOK
The year we have just lived through has presented a not inconsiderable number of challenging developments, as investors have had to rethink many deeply-held assumptions about government policies, societal dynamics, work patterns, family relationships, and economic security. Our ways of living, learning, being entertained, and working have undergone significant fundamental change in the United States and in many other parts of the world. Zoom Video Communications, Google’s Meet, Microsoft’s Teams, and other collaboration platforms have stepped into the void created by the cancelation of in-person meetings. Increasing numbers of citizens have hastened the process of relocating from high-tax parts of the country to more tax-efficient areas that may happen also to lower the cost of living and enhance their quality of life.
The changes effected last year have been profound and widespread and many have continued into 2021. Several segments of the economy — Including the hospitality, gaming, lodging, and travel sectors, among others — are likely to require significant amounts of time to return to pre-crisis conditions. With the pandemic having unsettled in-person schooling, exacerbated incomes and societal inequality, and spurred change in social justice, climate awareness, and innovation, disruptive forces are likely to persist in areas ranging from traditional business models to fossil fuels to all levels of education. The shift toward Asia — in China and other countries — in the global economy has accelerated in the past 12 months. With its consumer sector projected to grow from 45% of the Chinese economy in 2020 to 60% in 2025 (Source: The Wall Street Journal), China has also stepped up its investments in semiconductors, artificial intelligence, 5G wireless, and other core technologies, and these emphases appear likely to continue.
With some degree of caution, we remain essentially constructive on the U.S. equity market outlook, owing to:
i. Continued levels of meaningful monetary policy support, in the form of ultra-low short-term interest rates and money printing (“Quantitative Easing”) by the Federal Reserve to purchase $120 billion per month of U.S. Treasury and mortgage-backed securities;
ii. Substantial fiscal stimulus by the U.S. government, likely in the $1.0–$1.5 trillion range;
iii. An accelerated pace of coronavirus vaccines rollout;
iv. High corporate, federal government, and household cash balances (even before the recent Treasury distribution of $600 checks, not to mention the Administration’s proposed new round of checks, personal savings are $1.5 trillion higher than pre-pandemic levels);
v. Healthy equity sector and style rotation, including growth to value, large-cap to small- and mid-cap, defensives to cyclicals, and domestic to international;
vi. An improving economic outlook — based on assumptions that the economy can decouple from the coronavirus through the vaccines program, economists expect considerable pent-up demand for household consumption in the latter half of the year, with U.S. 2021 GDP likely to meet or even exceed the +5.1% forecast of the International Monetary Fund (raised from +3.1% on January 26th); and
vii. Analysts’ expectations of robust year-over-year S&P 500 revenue and corporate profits gains, with projected growth rates as reported by Factset on January 29th as follows — for 1Q21, revenue growth of +4.8% and earnings growth of +19.6%, for 2Q21, revenue growth of +15.1% and earnings growth of +48.7%, for 3Q21, revenue growth of +9.0% and earnings growth of +16.0%, for 4Q21, revenue growth of +7.0% and earnings growth of +17.2%, and for full year 2021, revenue growth of +8.7% and earnings growth of +23.6%.
At the same time, given widespread investor bullishness, elevated valuations of stocks and (especially) bonds, and numerous instances of broadening speculative activity — in call options buying, cryptocurrency infatuation, heightened household equity trading participation, and IPO volume (fully half of which in 2020 was for “blank-check” companies, also known as Special Purpose Acquisition Companies, or “SPACs”), we feel it is prudent to be prepared for one or more possibly meaningful market corrections during the course of this year.
For the rest of 2021, investors need to consider what can go awry at the same time as they are contemplating optimistic scenarios. Included among the potential factors that could derail advancing equity prices are:
i. Faster-than-expected increases and/or higher-than-expected increases in interest rates;
ii. Pandemic setbacks (including coronavirus mutations and/or decisions not to be vaccinated by a sufficiently large portion of the population leading to renewed economic lockdowns);
iii. Legislative passage of more burdensome-than-anticipated tax increases;
iv. Serious deterioration in U.S.-China relations;
v. Disappointing results on the earnings and/or regulatory fronts, especially for highly-valued bellwether technology and social media companies; and
vi. Episodes of serious turbulence in the global currency and/or energy markets.
Formidable levels of euphoria exist in several areas of the financial realm, and assessments of an economic recovery in 2021 may already be somewhat reflected in the pricing of many stocks and industry sectors.
The Cyclically-Adjusted Price Earnings ratio (also known as the CAPE ratio, or the Shiller ratio, named after its creator, 2013 Nobel Economics Laureate Yale Professor Robert Shiller) is calculated by dividing prices not by one year’s trailing or forward earnings, but by the average of the past 10 years’ inflation-adjusted earnings. The chart below shows that the current reading for the CAPE ratio, at 34.88, is 108% above the CAPE ratio’s long-term median reading of 16.78, and with one exception (in December 1999, when it reached 44.19) the highest it has been in the 140-year history of this data series.
Several other valuation measures — including forward and trailing price-earnings ratios, and total equity market capitalization-to-GDP ratios — are quite extended and may not offer much support in the face of unpleasant surprises on the U.S.-China relationship, setbacks in economic momentum, seriously dysfunctional political discord, and especially, inflation (due to its influence on interest rates).
The chart below shows many of the key drivers that could put upward or downward pressure on inflation.
For now, based on considerable unused capacity in the manufacturing sector and in the labor force, we expect only modest increases in inflation over the full year — even as some of the numbers that will be reported over the April-July 2021 time frame could possibly show potentially worrisome rates of gain versus the distressed conditions of a year earlier. At its December 15th-16th meeting, the Federal Reserve Open Market Committee expressed expectations of PCE (Personal Consumption Expenditures) inflation reaching +1.8% in 2021, slightly above its previous estimate of +1.7%.
Multiples of Enterprise Value-to-EBITDA (earnings before interest, taxes, depreciation, and amortization) are in the high 90th percentiles of their historical values. It is important to keep in mind that lofty equity valuations for 2021 and 2022 remain highly dependent on interest rates remaining low — by no means an inevitable outcome, given: (i) nascent inflationary trends (as potentially stoked by the drivers in the abovementioned chart); (ii) large projected issuance of government debt; and (iii) waning foreign demand for U.S. Treasury bonds.
Successful investment outcomes in 2021 may very well be achieved more from (i) generating what is referred to as “idiosyncratic alpha” (that is, by selecting specific asset classes, securities, sectors, and managers) rather than relying on (ii) market beta (primarily aiming to copy the performance of the broad stock and bond market indexes). Concurrently, we expect a broadening out of the main drivers of the indexes, in contrast to how in 2020 only three stocks, Apple (+80%), Amazon (+76%), and Microsoft (+41%) accounted for more than half of the S&P 500‘s +16.3% total price gain. And without the top 24 largest-cap companies, heavily represented by technology, social media, and digital services, the S&P 500 would have actually experienced a negative price return in 2020.
RECENT MARKET RUCTIONS
On Tuesday, February 2nd, U.S. Treasury Secretary Janet Louise Yellen called a meeting — inviting senior officials from the Federal Reserve Board, the Federal Reserve Bank of New York, the Commodity Futures Trading Commission, and the Securities and Exchange Commission — to examine, among other topics: the late January and early February upsurge in stock market volatility; the content and uses of online investor forums such as the Wall Street Bets subreddit; the high retail investor-driven trading volume in stocks and options; the massive intra- and inter-day price swings and broker-imposed trading restrictions in the shares of GameStop, AMC Entertainment, Express, Blackberry, Bed Bath & Beyond, Koss, and other companies and assets, including silver and Special Purpose Acquisition Companies (“SPACs”) . Other Authorities investigating these issues include the U.S. House of Representatives Financial Services Committee, which has scheduled hearings beginning Thursday, February 18th, and the U.S. Senate, which has also called for hearings.
Recent price histories for the shares of GameStop and AMC Entertainment are shown in the charts below.
Shares of GameStop, AMC Entertainment, and a number of other companies had been targeted by a motley, passionate, somewhat aggrieved, rapidly expanding online community of (often neophyte) investors seeking to drive their stock prices higher in efforts: (i) to generate short-term trading profits; and/or (ii) to penalize hedge funds and other investors who had “sold the shares short” (meaning the hedge funds and others had borrowed the shares and sold them, hoping for a price drop that would allow them to replace the shares at a lower price and thereby earn a profit).
In our opinion, the regulators’ analytical oversight and analysis of recent weeks’ unusually labile price behavior stems not only from whipsawing prices in a handful of stocks, but also from broader concerns over:
i. Appropriate regulation and enforcement, strengthening investor protections against price manipulation and other forms of market-based malfeasance;
ii. Fortifying minimum levels of investor education and risk awareness, especially in the derivatives markets and in the use of leverage (please refer to the following chart for a depiction of the current high levels of stock market leverage) — which, it can be seen, tend to accelerate downward equity market price movements during meaningful stock market selloffs;
iii. Preserving the functioning of fair and orderly securities markets;
iv. Adapting risk monitoring and other surveillance mechanisms to keep pace with changes in communications methods, social networking and online communities’ mores and memes, artificial intelligence, high frequency trading, and algorithmic investment protocols;
v. Educating the public about the components, costs, risks, and benefits of trading restrictions, the activity of bots, interest on customers’ credit balances, margin lending and margin calls, trading spreads earned by market makers, short interest levels, commission-free trading activity, and payment-for-order-flow;
vi. Constructing adequate safeguards to slow, or in some cases prevent, contagion (where significant stresses in one part of the securities markets lead to equally if not more severe stresses in other parts of the securities markets);
vii. Ensuring the robust financial strength and the problem-free, reliable operation of the Depository Trust and Clearing Corporation, the National Securities Clearing Corporation, and other settlement and clearing systems in American capital markets; and
viii. Establishing explicit — even if voluntary — standards and guidelines for posts on social media, similar to those governing the publication of written investment research reports, discouraging overly flamboyant, promissory, or inflammatory statements.
Armed with some degree of historical perspective and knowledge that all manias usually come to an unattractive end, our counsel for some time has been and continues to be deeply grounded in the following principles:
i. An elemental component of long-term investment success in liquid securities markets involves (a) keeping in mind that a fundamental motivation for investing in equities is to gain exposure to long-term value creation by business, and (b) gaining and maintaining exposure to high-quality assets that allow the investor to generate compound returns over time;
ii. It is important to avoid getting caught up in crowd-driven manias in the financial markets, and among the ways to keep distance and perspective is to seek the input and advice of people with investment experience and sound judgment; and
iii. Investors need to devote time and thought to formulate a sound investment plan, and keep to it, only giving consideration to making meaningful revisions (a) when warranted by changes in personal circumstances and/or the economic and financial environment; and/or (b) when asset prices depart widely (on the upside or downside) from fundamental values.
PORTFOLIO POSITIONING
1. Strategies and Tactics: In the current post-election environment and throughout its expected evolution in the early years of the new presidential and congressional term, we continue to maintain that careful thought, planning, and attention needs to be devoted to the investor’s most appropriate forms and vehicles for implementing the fundamental elements of Asset Allocation and Investment Strategy:
i. Diversification: which means having sustainably low- and negatively-correlated investment exposures that truly counterbalance price movements in other assets, particularly during times of great financial stress and/or market volatility;
ii. Rebalancing: which encompasses using concepts of reversion to the mean to trim exposures to assets that have grown to represent too large a portion of the overall portfolio, while at the same time, adding exposure to high-quality assets that have fallen out of investor favor and suffered significant, though likely not permanent, price declines;
iii. Risk Management: which involves recognizing when markets become consumed by momentum plays and information overload — a situation that pertains to numerous companies in the technology space – and understanding the degree of liquidity, the true pricing realism, and the various roles of short-term liquid securities, real assets, financial assets, and alternative assets in decade-long (or longer) regimes of inflation, stagflation, deflation, monetary disruptions, and currency resets;
iv. Reinvestment: which encompasses knowing when to emphasize and trade off income versus capital growth, all the while keeping in mind the critical importance of discipline, patience, and longevity in capturing and compounding dividend, coupon, and other income flows; and
v. Asset Protection and Husbandry: which encompass considerations of taxation at the state, local, federal, and possibly international level; estate planning; relevant insurance design and structuring; cybersecurity shielding; portfolio monitoring and reporting; administrative costs; forms and means of access; and custody.
2. Intermediate-Term Themes to Consider: We continue to allocate to a considered and considerable exposure to equities, with judicious shifts between styles, sectors, geographies, and — where appropriate from a cost, timing, liquidity, and size standpoint — public versus private markets. Expressed below are a number of themes that we believe should be taken into consideration over the next few years in selecting asset categories, asset classes, sectors, companies, and security types:
i. Paying Attention to the Value of Money: Taking advantage of (rather than being taken advantage of by) the likelihood of money printing, internal and external currency debasement, government debt monetization, and the ‘Modern Monetary Theory’ likely to continue being pursued by the Authorities — within shifting money and credit cycles — to service America’s massive explicit government and corporate indebtedness and the enormous implicit obligations of pension and healthcare promises;
ii. Concentrating on “All-Weather” Sectors and Companies: Seeking investments with balance and flexibility, that are able to thrive regardless of a now apparently “blue wave” unified congress, evolving social priorities and values, wealth distribution initiatives, public health conditions, and political trends;
iii. Distinguishing Between Temporary and Permanent Change: Focusing on the commercial and financial implications of new social and political power structures, alliances, and geopolitical relationships; new energy sources and resources; new trade patterns; new on- and offshoring channels; “WFH” and “WFA” (Work From Home and Work From Anywhere) employment modalities; and new business models, pathways, digitalizations, and forms of person-to-person and business-to-business work, leisure, learning, and wellness;
iv. Taking Advantage of Demographic Tailwinds: Through U.S. and select non-U.S. companies, gaining exposure to and meeting the rising needs, aspirations, and spending power of the rapidly expanding global middle class, especially in Asia;
v. Comprehending and Verifying Past Success: Emphasizing companies and sectors that have demonstrated successful track records and past experience in: capital allocation; balance sheet strength; risk management; sustainably defendable business models; and the ability to generate and sustain high multiyear returns on equity (derived from revenue growth and favorable margin preservation, rather than through excessive leverage) meaningfully above the companies’ and sectors’ weighted average cost of capital; and
vi. Identifying Innovative and Disruptive Technology Hegemons: Focusing on technology enablers, disrupters, and dominators in biotechnology, public health, artificial intelligence, data analytics, machine learning, 5G cellular network technology, the Internet of Things, robotics, quantum computing, battery inventions, alternative energy, electric vehicles, and cybersecurity, while paying heed to the environmental, social, and governance (ESG) characteristics of companies in these fields.
3. Keeping Things in Perspective: Many of the overarching themes and conditions that influence our intermediate- and long-term asset allocation and investment strategy emphasize the need to recognize that the concepts and implementation methods intended to achieve safety, balance, diversification, and liquidity are likely to face evolving taxation regimes, social priorities, geopolitical power relationships, price level changes, demographic trends, indebtedness levels, technological pervasiveness, and not least, the definition, role, degree of physicality, embodiment, and value of money itself.
4. Flexibility versus Conviction in Formulating Investment Thinking: In seeking to determine when to adhere to, and when to lean against, prevailing consensus views (sometimes pejoratively referred to as “groupthink”), it is important to critically question the soundness and durability of the reasoning and assumptions underlying a given investment framework and positioning at any point in time. While it may not make sense to hold out-of-consensus views just for the sake of doing so — often expressed as “don’t fight the tape,” — at other times — especially at major cyclical or secular turning points (at a major asset top, when reality is finally found to fall short of overly optimistic expectations, or a major asset bottom, when reality is shown to be worth considerably more than the prevailing overly pessimistic expectations), the rewards of implementing a contrarian stance can be extremely meaningful.
Some observations on the environment and conditions expected in the quarters and year ahead are set forth in the sections below.
5. Enhancing and Preserving: While we confess to an even greater than last year’s feeling of unease over the spreading investor exuberance and the growing popularity of stocks and sectors considered to benefit from economic recovery as vaccines are rolled out to contain and even halt the pandemic — our short-term inclination at this juncture is to take note of the Federal Reserve’s ongoing support of financial asset prices while taking advantage of such strength to continue upgrading portfolio holdings — offloading lower-quality, higher-risk assets and with timing and price discipline, adding to attractively-priced, higher-quality assets on equity market pullbacks.
6. Equity Emphases and De-emphases: Particularly in the current conditions of very low U.S. Treasury interest rates, and given the likely focus areas of government spending initiatives, to us it appears likely that cash-generating, financially-stable companies with robust growth prospects, which are able to operate and thrive in the digital sphere as they continue to enhance their business models, deserve to retain a valuation premium. Within equities one may consider: (i) continuing to gradually shift some emphasis from Growth sectors, companies, and managers towards the incremental inclusion of select Value sectors, companies, and managers; (ii) modestly adding small- and mid-cap companies (or investment managers specializing in and with good track records in this space) to our primary yet lessening emphasis on large-capitalization enterprises; and (iii) for the time being, while we continue to prefer a tactical overweighting to U.S. domestic equities but beginning to build higher allocations to emerging market equities and our underweight position in the international developed markets.
7. Focus on Strength and Quality: Our long-term equity portfolio weightings continue to emphasize asset managers, sectors, and specific companies that can benefit from the major sustained trends of the 2020 decade, including: (i) incremental growth in a wide range of economic circumstances; (ii) a focus on economic repair, digitalization, e-commerce, personal wellness, safety, domesticity, home improvement, infrastructure spending, and where possible, the release of pent-up consumer demand; and (iii) advantageous capture of benefits from onshoring, supply chain redesign, and deglobalization as important drivers of capital spending and disruptive innovation. At the company level in equities, we emphasize identifying and building long-term exposure to firms possessing fortress-like, cash-rich balance sheets, limited debt, positive free cash flow generation, dividend strength, and competitive business models that over a long-time frame can generate high returns on equity (as mentioned above in “Comprehending and Verifying Past Success,” through revenue growth and enduring profit margins, rather than through excessive levels of leverage).
8. Balancing Growth and Value Sectors: Through Wednesday, February 5th, the iShares Russell 1000 Growth ETF (symbol IWF, and including companies in sectors such as technology, healthcare, and communication services) had (according to The Wall Street Journal) returned +4.3%, while the iShares Russell 1000 Value ETF (symbol IWD, and including companies in sectors such as financial, real estate, energy, utility, and industrial companies) had (according to The Wall Street Journal) returned +3.8%; this 0.5 percentage point Growth minus Value returns differential is much narrower than the 30-plus percentage point Growth minus Value differential in recent months and to us appears now to argue for continuing the process of prudent reallocation from selected Growth sectors, companies, and managers into selected Value sectors, companies, and managers. As this process continues, it is worth keeping in mind that true value investing represents identifying assets that are trading for less than they are actually worth, not assets that are merely inexpensive; many superficially inexpensive assets are inexpensive for a reason and can very well remain so or deteriorate further.
9. Fixed Income Securities: Bond prices remain at extremely elevated price levels, with ultralow yields across the maturity spectrum, having risen only modestly since year-end 2020 (with, according to Bloomberg in mid-December, an astounding total of $18 trillion in global negative yielding sovereign — and some corporate — debt outstanding). We affirm our predilection for issuers at the high-quality end of the rating spectrum, both in investment grade and in high-yield bonds, in taxable bonds, and in tax-exempt bonds (where we continue to see some pockets of value on a taxable equivalent basis). We see fixed income securities price risk due to our expectation of further increases in yield levels as 2021 progresses, and thus we prefer maturities and durations along the short-to-intermediate portion of the yield curve spectrum.
10. U.S. Dollar Outlook: After declining -7.4% In 2017, appreciating +4.3% in 2018, marginally slipping -0.2% in 2019, and declining -5.1% in 2020, the DXY U.S. dollar index measured versus a basket of six major currencies — the euro, Japanese yen, Swedish kroner, British pound, Canadian dollar, and Swiss franc — had as of the market close on February 5th, appreciated +1.2% year-to date in 2021. We believe the U.S. dollar may trace a gradual path of weakness as — due primarily to the Federal Reserve’s stated preference for lower yields in the United States for the next 12 months or even longer — the U.S. dollar’s income-generating advantage is likely for the time being to remain narrow or nonexistent versus other major currencies.
11. Alternative Investments and Real Assets: In alternative investments, we continue our multi-quarter focus that has for some time emphasized exposure to: upstream natural resources ETF/shares (particularly the miners with reserves in stable geographic locations, capital discipline, and cash flow growth); select investments in private credit and private real estate; and opportunistic private equity strategies/direct investments that are positioned to selectively derive meaningful value from the dislocations created by the coronavirus pandemic and the gradually increasing recovery that we expect in the year ahead as well as those which may provide a better use of risk budget relative to public markets.
DISCLOSURES
*Aaron Wealth Advisors LLC is registered as an investment adviser with the Securities and Exchange Commission (SEC). Aaron Wealth Advisors LLC only transacts business in states where it is properly registered or is excluded or exempted from registration requirements. SEC registration does not constitute an endorsement of the firm by the Commission nor does it indicate that the adviser has attained a particular level of skill or ability.
*This material is not intended to be a recommendation or investment advice, does not constitute a solicitation to buy or sell securities, and is not provided in a fiduciary capacity. The information provided does not take into account the specific objectives or circumstances or any particular investor or suggest any specific course of action. Investment decisions should be made based on an investor’s objectives and circumstances and in consultation with his or her advisors. The information contained in this presentation represents factual information, analysis, and/or opinions regarding various investments. Any opinions expressed in this material reflect Aaron Wealth’s views as of the date(s) indicated on the Presentation and are subject to change.
*Past performance may not be indicative of future results. Therefore, no current or prospective client should assume that the future performance of any specific investment, investment strategy (including the investments and/or investment strategies recommended by the adviser), or product made reference to directly or indirectly, will be profitable or equal to past performance levels.
*This document contains forward looking statements, including observations about markets and industry and regulatory trends as of the original date of this document. Forward looking statements may be identified by, among other things, the use of words such as ”expects,” “anticipates,” “believes,” or “estimates,” or the negatives of these terms, and similar express results could differ materially from those in the forward looking statements as a result of factors beyond our control. Recipients of the information herein are cautioned not to place undue reliance on such statements. No party has an obligation to update any of the forward looking or other statements in this document.
*All investment strategies have the potential for profit or loss. The investment strategies illustrated in this document and listed above involve risk, including the risk of loss of principal.
*The firm is not engaged in the practice of law or accounting. Content should not be construed as legal or tax advice. Always consult an attorney or tax professional regarding your specific legal or tax situation.
*This material is proprietary and may not be reproduced, transferred, modified or distributed in any form without prior written permission from Aaron Wealth Advisors. Aaron Wealth reserves the right, at any time and without notice, to amend, or cease publication of the information contained herein. Certain of the information contained herein has been obtained from third-party sources and has not been independently verified. It is made available on an “as is” basis without warranty. Any strategies or investment programs described in this presentation are provided for educational purposes only and are not necessarily indicative of securities offered for sale or private placement offerings available to any investor.
Background of Key Players and Events
Reddit Forum “WallStreetBets”: WallStreetBets is an online community with associated posts/message boards on the social media site Reddit where participants discuss stock and option trading ideas. Over the past 6 months, members of this community have been encouraging each other to purchase shares of struggling companies that are some of the most-shorted stocks by large Wall Street hedge funds and institutional investors (more on shorting stocks in the next section). With growing participation in day trading by individual investors due to the coronavirus pandemic and burgeoning retail trading platforms like Robinhood, the momentum behind this trading strategy has snowballed precipitously across various internet platforms and retail investors as the share price of companies like GameStop have skyrocketed. At times, there has been coordinated buying by members of various groups and new investors continue to jump onboard to participate in what could aptly be described as a “get-rich-quick” scheme.
Wall Street Hedge Funds: Several large, multi-billion-dollar hedge funds that are widely considered to be the most sophisticated traders on Wall Street have built massive bearish positions (i.e. short positions) on a number of companies whose business models have been crushed by the shift towards online retail shopping at the expense of brick-and-mortar stores. Bearish bets on brick-and-mortar retail – along with other sectors decimated by the coronavirus pandemic (think movie theater companies like AMC) – have increased dramatically since early 2020. Notable names in this case are the hedge fund, Melvin Capital, and short-seller, Citron Research, that had amassed substantial bearish positions in these companies. Their trading strategies are grounded in traditional fundamental analysis and strategic themes.
• The Battle between Wall Street & Main Street: This has been pitched as a war between the everyday individual investor and the financial titans of Wall Street. As retail investors have gained momentum and power to move the market of individual companies, this feeling of “good vs. evil” has grown as a battle cry with several social media investing forums expressing the goal of collapsing targeted Wall Street trading firms. This week it was announced that Melvin Capital received a $2.75 billion investment from Chicago-based hedge fund, Citadel, and Steve Cohen’s Point72 Asset Management to shore up the firm’s capital position and become less reliant on margin lending from its banking relationships (a.k.a. prime brokers) that could force them to close out positions at inopportune times.
Definitions of Key Terms and Trading Strategies
Shorting a Stock: Shorting a stock is a trading strategy that bets against the share price of that particular stock. It is the opposite of buying – or going long – a stock that an investor believes will appreciate in value. A short position expresses a bearish view, while a long position expresses a bullish view. To execute a short on a stock, the short seller borrows shares of the company from a lender who owns a long position (and pays the lender some pre-determined interest, or margin, rate for this service). The short seller then sells the borrowed stock at the current market rate and hopes to buy the position back in the future at a lower share price. Those repurchased shares are then delivered back to the lender to close out the short position. For example, assume a short seller wants to short 100,000 shares of GameStop when its share price is $15. He would borrow 100,000 shares from the lender and sell them at the current market price of $15, collecting $1.5 million in proceeds. If the share price subsequently declines to $5, the short seller could repurchase 100,000 shares of GameStop for $500K, deliver the borrowed shares back to the lender to close out the short position, and make a profit of $1 million. However, if the share prices rallies, the short seller begins losing value on the trade. If the share price continues to climb, the lender will require additional capital be posted as collateral to mitigate their risk.
Put Option Contract: For the buyer of a Put Option, this contract gives the buyer the right – but not the obligation – to sell shares of the underlying company (like GameStop or AMC) at a predetermined price (also known as the strike price). This is often a way for the buyer to express a bearish view on a stock. For example, if one were to purchase 1 Put Option contract at a strike price of $80 with a 3-month maturity, this buyer would have the right – but not the obligation – to sell 100 shares of GameStop at $80 over the 3-month period (1 option contract represents 100 shares of the underlying stock). This strategy would be profitable if the share price of GameStop was lower than $80 over the 3-month period. If the buyer exercises their put option (because it is profitable to do so), the seller of the contract is obligated to buy 100 shares of GameStop at $80 (experiencing a loss because they have now paid more for a security than it is currently worth). For context, many Hedge Funds have been massive buyers of Put Options on GameStop, AMC, and other struggling companies recently.
Call Option Contract: For the buyer of a Call Option, this contract gives the buyer the right – but not the obligation – to buy shares of the underlying company (like GameStop or AMC) at a predetermined price (also known as the strike price). This is often a way for the buyer to express a bullish view on a stock. For example, if one were to purchase 1 Call Option contract at a strike price of $130 with a 3 month maturity, this buyer would have the right – but not the obligation – to purchase 100 shares of GameStop at $130 over the 3 month period (1 option contract represents 100 shares of the underlying stock). This strategy would be profitable if the share price of GameStop was higher than $130 over the 3-month period. If the buyer exercises their call option (because it is profitable to do so), the seller of the contract is obligated to sell 100 shares of GameStop at $130 (experiencing a loss because they have now sold a security for less than it is currently worth). For context, many individual investors, in aggregate, have been massive buyers of Call Options on GameStop, AMC, and other struggling companies recently.
Put/Call Ratio: This is the ratio of Put Option volume relative to Call Option volume and can be viewed as a gauge of market sentiment on a stock. A high put/call ratio implies bearish sentiment, while a low ratio implies bullish sentiment.
Short Squeeze: A short squeeze occurs when the share price of a short seller’s stock rapidly increases. As a result, the short seller may be forced to close out their short position due to risk- or capital-constraints, even if they still have a bearish view on the stock and believe it will decrease over time. Being forced to close out a short position due to a short squeeze is disadvantageous and destructive to the trading strategy, even if the thesis ends up proven correct. Short squeezes can happen naturally due to market movements, but in other circumstances, they can be executed intentionally to force a negative outcome for the short seller. In the case of GameStop and AMC, Main Street investors are intentionally, some may say maliciously, squeezing hedge funds with large short positions.
How the Situation has Played Out: GameStop Case Study
• On July 31st, 2020, shortly before the momentum of social media forums drove the stock to rise, GameStop’s price per share was $4.01. As of yesterday (January 27th), the price had ballooned to $347.51, representing a gain of 8,566% in less than 6 months. The overwhelming majority of this rally has come in the past two weeks, as the share price remained below $20 prior to January 13th. This two-week surge is a prime example, albeit an incredibly extreme one, of a short squeeze.
• The buying momentum from retail investors isn’t the only reason for the violent and rapid upward trajectory though. While it can be seen as the major catalyst, several other mechanisms are at play here that have caused the momentum to become a self-fulfilling prophecy. The next few bullet points will explain in more detail.
• As the share price of GameStop accelerates upward, short sellers are squeezed. And as we outlined earlier, this can force them to cover their short positions due to risk- or capital-constraints. To cover and close out the positions, the short seller is forced to buy the stock at the current market value of the shares. This adds to the buying demand and drives the price even higher.
• Banks and other market-makers are more often than not the counterparty in option contract positions. Their goal is to be hedged in their net exposure to any security. As such, as option contracts are entered into, the bank will execute offsetting transactions to hedge their risk. To hedge the risk of selling Call Options, the bank would purchase shares of the underlying stock in order to remain neutral. When retail investors, again in aggregate, build massive Call Option positions, the banks and market-makers that are counterparties (i.e. have sold the Call Options on GameStop) must buy shares at the current market price of GameStop to hedge their exposure. This also adds to the buying demand and drives the share price higher still.
• Starting on January 28th, several large custodians and trading platforms – such as TD Ameritrade, Charles Schwab, Robinhood, and others – have enacted trading restrictions on a number of stocks, including GameStop and AMC. According to various announcements, restrictions include some or all of the following: cannot establish new long stock or option positions, increased margin requirements, disallowed naked option positions (i.e. option positions without owning the underlying shares), and liquidation only trades. As a result, at the time of this writing, the share prices of GameStop and AMC were down over 50% in intraday trading.
• It is yet to be determined how this story will end. However, it will likely serve as a cautionary tale for investors considering jumping into bandwagon trades that are fueled purely by momentum and speculation rather than being grounded in reality. On its face, it appears eerily familiar to the “pump-and-dump” schemes made famous by movies like Boiler Room or The Wolf of Wall Street. Once the selling starts, the share prices of these companies will plummet back to earth at lightning speeds. And without the artificial buying demand of the aggregate crowd, those left with long positions ultimately will end up holding the bag.
DISCLOSURES
*Aaron Wealth Advisors LLC is registered as an investment adviser with the Securities and Exchange Commission (SEC). Aaron Wealth Advisors LLC only transacts business in states where it is properly registered or is excluded or exempted from registration requirements. SEC registration does not constitute an endorsement of the firm by the Commission nor does it indicate that the adviser has attained a particular level of skill or ability.
*This material is not intended to be a recommendation or investment advice, does not constitute a solicitation to buy or sell securities, and is not provided in a fiduciary capacity. The information provided does not take into account the specific objectives or circumstances or any particular investor or suggest any specific course of action. Investment decisions should be made based on an investor’s objectives and circumstances and in consultation with his or her advisors. The information contained in this presentation represents factual information, analysis, and/or opinions regarding various investments. Any opinions expressed in this material reflect Aaron Wealth’s views as of the date(s) indicated on the Presentation and are subject to change.
*Past performance may not be indicative of future results. Therefore, no current or prospective client should assume that the future performance of any specific investment, investment strategy (including the investments and/or investment strategies recommended by the adviser), or product made reference to directly or indirectly, will be profitable or equal to past performance levels.
*This document contains forward looking statements, including observations about markets and industry and regulatory trends as of the original date of this document. Forward looking statements may be identified by, among other things, the use of words such as ”expects,” “anticipates,” “believes,” or “estimates,” or the negatives of these terms, and similar express results could differ materially from those in the forward looking statements as a result of factors beyond our control. Recipients of the information herein are cautioned not to place undue reliance on such statements. No party has an obligation to update any of the forward looking or other statements in this document.
*All investment strategies have the potential for profit or loss. The investment strategies illustrated in this document and listed above involve risk, including the risk of loss of principal.
*The firm is not engaged in the practice of law or accounting. Content should not be construed as legal or tax advice. Always consult an attorney or tax professional regarding your specific legal or tax situation.
*This material is proprietary and may not be reproduced, transferred, modified or distributed in any form without prior written permission from Aaron Wealth Advisors. Aaron Wealth reserves the right, at any time and without notice, to amend, or cease publication of the information contained herein. Certain of the information contained herein has been obtained from third-party sources and has not been independently verified. It is made available on an “as is” basis without warranty. Any strategies or investment programs described in this presentation are provided for educational purposes only and are not necessarily indicative of securities offered for sale or private placement offerings available to any investor.