
Introduction
Since the dawn of mankind, humans have been afflicted with an insatiable appetite for attempting to divine what the future holds. Proof of this innate obsession is embedded throughout history with examples stretching back to antiquity. The Babylonians (approx. 2000 BC – 1600 BC) would closely examine a sheep’s liver, attributing insights about the future to specific anatomical surface features.1 Roman general Claudius Pulcher famously consulted and relied heavily on “sacred chickens” when seeking wisdom for upcoming battles, bringing a coup to every ground.2 And given how vast the Roman Empire stood in its prime, one could easily conclude that these were some well-traveled chickens! As humanity advanced and industrialized, this hunger grew more voracious – catapulting supposed prophets and seers, like the Renaissance’s Nostradamus, to generational fame. However, as capital markets began to form and modernize, a new wave of fortune telling gained traction and legitimacy from the investing public. In his book titled, “Fortune Tellers: The Story of America’s First Economic Forecasters”, Walter Friedman writes how pioneers in the world of economic forecasting thrived during the period leading up to the Great Depression…but then ultimately failed to predict the crippling crash of 1929.
Today, with computing power capable of meticulously processing, analyzing, and torturing the vast world of data, economic and market forecasting – from GDP growth to interest rates to stock prices – is generally viewed as a noble pursuit of science and empirical research. All that stands in the way of predicting the market’s next move is the discovery of a “perfect” model that can dissect and explain the intricacies of our modern financial universe. Through our modern lens, it is easy to look back on the forecasting methods of the ancient Babylonians and Romans as foolish and crude. But we should ask ourselves – how much more accurate are we than they? While it is difficult to exactly quantify the precision of our primeval counterparts (despite knowing General Pulcher’s forces went on to suffer complete defeat by the Carthaginians in direct contradiction to the prophesy of “the sacred chickens”), forecasts today can be tested for accuracy.
In this edition of Aaron Wealth Advisors’ “The View from Here” we try to navigate the turbulent waters of predicting future interest rate movements, specifically how the Federal Reserve’s Dot Plot and the market’s implied path of interest rates can lead investors to make poor decisions based on false confidence.
However, prior to jumping into our analysis and conclusion, we set the stage by addressing the following:
1. How interest rates drove capital markets in 2023.
2. The purpose behind the Dot Plot and how its popularity has grown.
3. How wildly inaccurate interest rate forecasts devasted markets in 2022.
4. The historical reliability of the Dot Plot.
5. What to make of it all and investment implications.
For those interested in only the result, punchline, or interpretation, let’s just say “those that live by the crystal ball…tend to eat shattered glass.” – Ray Dalio.
2023 – Narrative Shifts Overshadowing Notable Market Drivers
Last year marked a clear departure from 2022, with most asset classes outperforming their prior year returns and surpassing consensus expectations. At the beginning of 2023, investors anticipated a slowdown in corporate earnings as elevated borrowing costs would likely pull the U.S. economy into a recession. However, financial markets avoided the recession many believed was inevitable and marched higher, with the S&P 500 posting a monstrous gain of more than 24% and the Dow finishing near a record high. The AI craze fueled the “Magnificent Seven” (Apple, Alphabet, Amazon, Meta Platforms, Microsoft, Nvidia and Tesla) to account for roughly 60% of the S&P 500’s returns in 2023. Heading into the 4th quarter, the Bloomberg U.S. Aggregate Bond Index was on track to record its 3rd consecutive negative year and worst performance streak since its inception in 1986. But this ignominious result was sidestepped with the help of unprecedented interest rate fluctuations – wherein the 10-Year Treasury yield, after soaring to 5% in October, plummeted over the final seven weeks of the year and settled at 3.9%, identical to where it was 12 months ago.
Figure 1: Calendar Year & Trailing Market Returns (12/31/2022 -12/31/2023)3
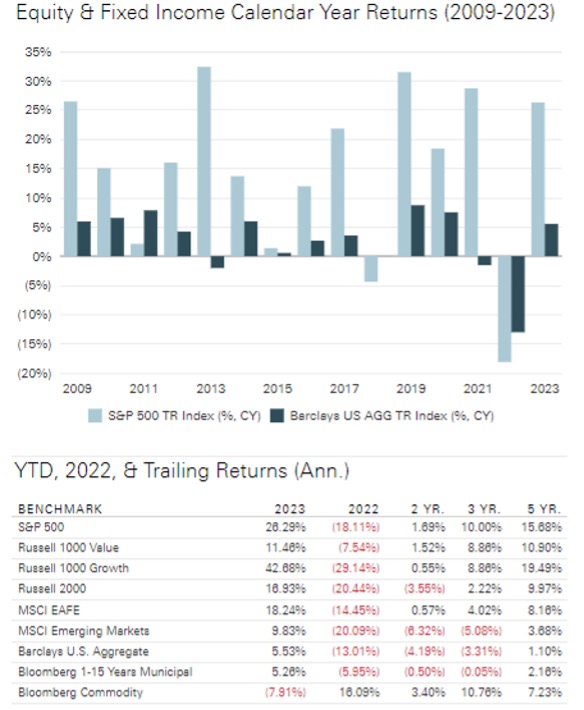
Amid one of the strongest “everything rallies” cycles in decades, financial markets seasoned an unexpected regional banking crisis, a U.S. government debt downgrade, and rising geopolitical tensions around the world. Last year will be remembered as a period where substantial shifts in the market’s narrative for monetary policy overshadowed notable developments in the fundamentals which ordinally drive investor sentiment. At the beginning of the year, most experts predicted an impending recession, but by summer, the consensus course corrected to the expectation of “higher for longer” inflation and interest rates. In the 4th quarter, the narrative whipsawed once again, this time focusing on subsiding inflation, speculation about a “soft landing” for the economy, and an increasing anticipation of rate cuts in 2024.
Figure 2: Fed Funds Rate vs 2- & 10-Year U.S. Treasury Yields3
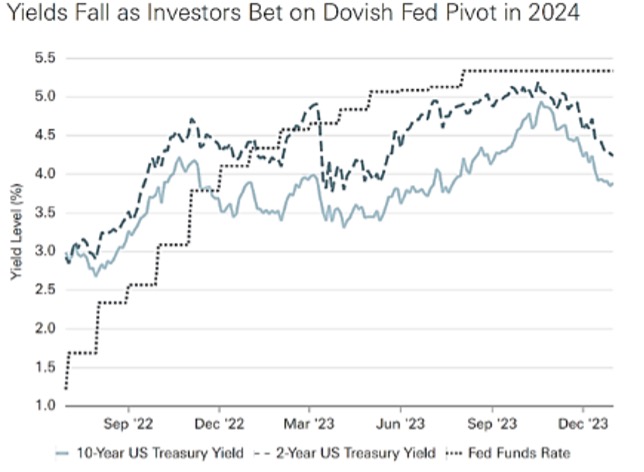
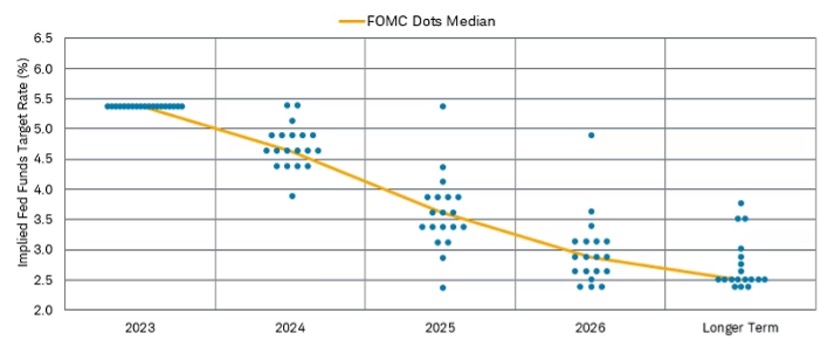
Encouraged by a decline in inflation, the December 13th Federal Reserve’s Open Market Committee (FOMC) Dot Plot signaled a significant drop in the Fed Funds rate over the next few years, returning to 2.5% over the long run. The Summary of Economic Projections (SEP) that accompanied the Dot Plot revealed that the median expectation of Fed officials forecasted three rate cuts of 0.25% each in 2024, aiming to bring the Fed Funds rate to 4.6%, compared to an estimate of 5.1% as recently as last September.
Figure 3: Federal Reserve, Summary of Economic Projections, December 13, 20234
These developments prompted a decline in bond yields while sparking celebration in the stock market that a “soft landing” or “no landing at all” scenario was within reach. Surely with the Federal Reserve’s tremendous resources, PhD-level expertise, unrestricted access to every morsel of relevant economic data, and wealth of experience, a soft landing should be a forgone conclusion, right? Well, empirical evidence suggests otherwise. And in some cases, investors would be better off doing the exact opposite of what the Fed Dot Plot depicts. This finding should prompt any rational market participant to question the validity of the Federal Reserve’s crystal ball.
Exploring the Dot Plot: Unraveling its Purpose & Growth in Popularity
The Federal Open Market Committee (FOMC) has published economic forecasts from meeting participants in its quarterly Summary of Economic Projections (SEP) since 2007. With the sole purpose of offering more transparency following the 2008 Global Financial Crisis, the Federal Reserve introduced the FOMC Dot Plot in 2012. At that time, the Federal Reserve aimed to offer the public early insight into the policies that Fed officials were contemplating for both the short- and long-term. According to Ryan Sweet, Chief Economist at Oxford Economics, it was their version of “aggressive forward guidance”. 5
Just as then, investors now analyze and compare iterations of the Dot Plot to gauge the direction (whether hawkish or dovish) of monetary policy. However, unlike then, the popularity of the Dot Plot and the media’s coverage of this once considered “non-event” have seemingly skyrocketed, as evidenced by the Google Search Interest below.
Figure 4: Google Search Interest & Trend for “Fed Dot Plot” 6
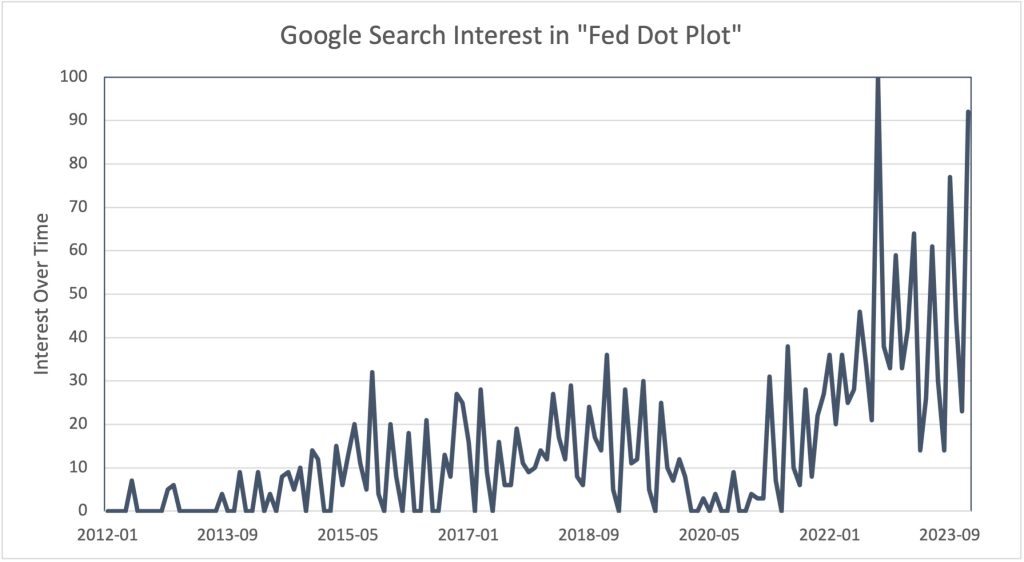
Interest Over Time
Numbers represent search interest relative to the highest point on the chart for the given region and time. A value of 100 is the peak popularity for the term. A value of 50 means that the term is half as popular. A score of 0 means there was not enough data for this term.
The market’s interpretation of these forecasts has also reflected this new level of “aggression”. Investors don’t have to look far into the rearview mirror to find examples of how the Dot Plot and Fed Funds Futures—a market-derived expectation for the path of interest rates— differ. And as we’ll discover, do at times, differ significantly. To keep consistent with the metaphor, consider the Federal Reserve as a GPS and the market as the driver determining the pace toward the destination. Akin to instances where the GPS leads us to a dead end or nudges us towards violating the speed limit, both the Fed and the market can do the same. And, as has happened frequently, the ramifications can be significant – i.e., when 2022’s “drive” took a more ominous turn, resulting in a “crash”. That year, both the S&P 500 and the Bloomberg U.S Aggregate Bond Index delivered returns deep in the red, down 18% and 13%, respectively, and cemented the bond market benchmark’s worst finish in its 37-year history.
Green Horizons or Optimistic Overshoot?
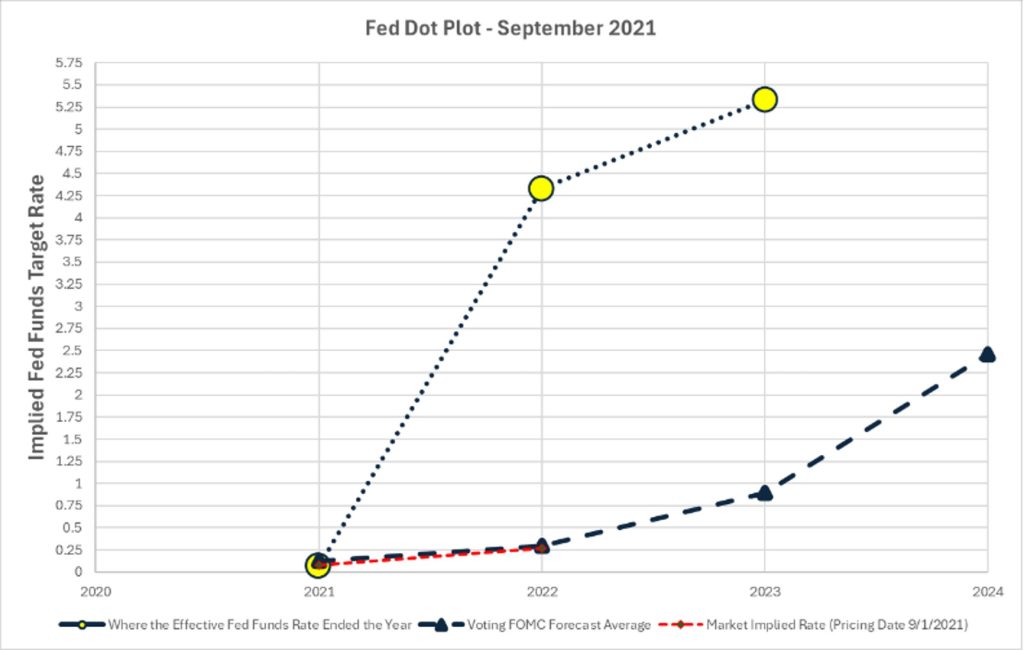
Just a short 23 months ago, interest rates were at historic lows and the Fed Funds target rate range was holding steady at 0% – 0.25%. It isn’t difficult for investors to recall what that environment looked and felt like in 2021. Covid-19 vaccines were being distributed, consumers were flush with cash, and the economy was experiencing robust growth as the “Great Re-Opening” unfolded. Inflation was surpassing the Fed’s target range. Yet, at that juncture, Chair Jerome Powell stated it was transitory and assured the country that rate hikes wouldn’t be required to tame it. His statement echoed the September 2021 Fed Dot Plot, which revealed the FOMC’s average projection for the policy rate at 0.292% by year-end 2022. This equates to just a single 0.25% hike, pushing their target range to 0.25% – 0.50%. Markets seemingly bought this transitory narrative, pricing rates to finish 2022 at 0.273%.
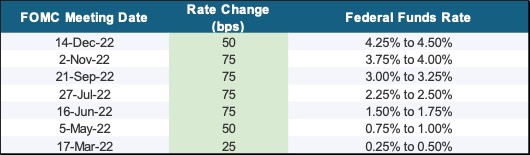
However, by March of 2022, inflation had eclipsed its highest rate in over 40 years. The Fed was forced to act and began increasing rates for the first time since before the pandemic. And, once the Fed decided it was necessary to slay the inflationary dragon, it took decisive action by hiking rates 4.25% over the coming 12 months.
Figure 5: Fed Rate Hikes 2022: Taming Inflation7
This led to one of the widest disconnects in financial market history, as both the Federal Reserve and the market vastly underpriced the economic reality and unpredictability of inflation heading into 2022. The September 2021 Dot Plot, September 2021 Fed Funds Futures Markets, and the realized Effective Fed Funds Rate illustrate this miscalculation (see Figure 6).
Figure 6: Disconnect between Fed Dot Plot, Fed Funds Futures (as of September 2021) and where rates finished 7
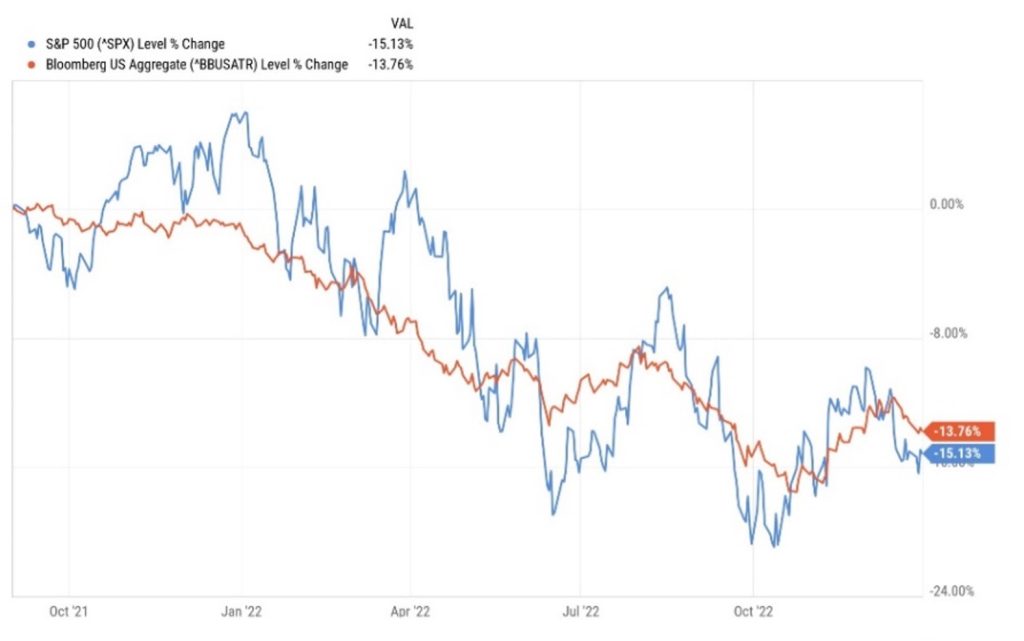
By the end of 2022, the cumulative effects of restrictive monetary policy required to combat record setting inflation readings resulted in equities delivering its worst year since 2008. Value stocks served as a loan bright spot, outperforming their growth counterparts by the widest margin since the Dot-Com Bubble Burst of the late 1990s. Since its inception, the Barclay’s U.S. Aggregate Bond Index has had only 5 negative years, and 2022 proved to be its worst in history – down 13%. Figure 7 illustrates the performance of the 2-asset classes from September of 2021 (coinciding with the Fed Dot Plot forecast) to the year end 2022 (coinciding with where rates finished).
Figure 7: Performance of US Stocks & Bonds (09/01/2021 – 12/31/2022) 8
The impacts of inaccurate forecasts had potential to outlive 2022, as reputable economists and firms had now forecasted a 100% certainty of a U.S. recession within one year. Bloomberg’s “recession probability model” forecasted “a higher recession probability across all timeframes, with the 12-month estimate of a downturn by October 2023 hitting 100%, up from 65% for the comparable period in the previous update.” 9 However, as described in 2023’s recap, financial markets went on to finish near all-time highs, completely reversing 2022’s trend and ignoring not only Bloomberg’s model, but all models calling for recession
in 2023.
Noticeably, the Dot Plot published in December 2023 (See Figure 3) has much greater dispersion in expectations relative to years prior. As of this publishing, their projections call for three rate cuts in 2024, with the FOMC sitting an average rate of 4.704%. 7 Although probabilities have slightly moderated now, at one point Fed Funds Futures (which represent market implied rates) had priced in six rate cuts over the course of the next 12 months. With the unemployment rate still below 4%, GDP growth running at 3% annually, U.S. Core Inflation at 3.93%, real wage growth increasing, and retail sales indicating consumer strength, have investors become disconnected from reality again?7 By historical standards, cutting rates when inflation is around 4% would be considered absurd. The upside of a narrative is that they’re almost always right. But the disadvantage is that they are already reflected in market prices. With risk assets priced to perfection and reaching new all-time highs, the market’s divergence between its interpretation of the Fed’s policy path and the Fed’s stated intentions should come with even greater caution.
“I don’t let people do projections for me because I don’t like throwing up on the desk.”
Charlie Munger
Charlie Munger, the legendary American businessman, investor, and philanthropist (who unfortunately passed late last year), had little time for market forecasters and their prognostications – politely put in comparison to his quote above. 10 Although he was unlikely referring directly to the Fed’s Dot Plot, let’s see if his logic applies!
Four times a year (March/June/September/December), the Fed publishes the predictions of its 19 participants. By examining past dot plots and comparing those rates to where rates actually finished, we can assess whether the Fed’s projections are historically predictive. We can measure the strength and direction between the 2 variables (FOMC’s Forecasts and the Effective Fed Funds Rate at year-end) by running a correlation analysis. Correlation is a statistical measure that describes the extent to which two variables change together. Correlation is often represented by a number called the correlation coefficient, which ranges from -1 to 1. A positive correlation means the variables move in the same direction (both increase or both decrease), while a negative correlation means they move in opposite directions. The closer the correlation coefficient is to 1 or -1, the stronger the correlation. And if it’s closer to 0, there’s a weak or no correlation. In simpler terms, it helps us understand whether there is a relationship between two things and how strong that relationship is. Although the computation comes with inherent limitations (implying causation, sensitivity to outliers, assuming homoscedasticity, limited sample size etc.), its application in this context provides valuable insight. And with (or without) surprise – forecasting interest rates gets cloudy.
- Using September and December Dot Plot reports since 2012 11, the FOMC’s short-term projections, covering approximately a 3-month to 2-week period until year-end, have consistently aligned closely with the year-end effective funds rate. The correlations between the projection and the actual rate stand at an impressive 0.997896 and 0.9994548, respectively.
- Using March and June Dot Plot reports since 2012 11, although lesser in strength (i.e. lower correlation coefficient), their forecasts are also in harmony. Correlations stand at 0.897486 and 0.979232, respectively.
This high correlation should not come as a surprise. By September and December, the FOMC has presumably thoroughly discussed its policy outlook for the remainder of the year and is unlikely to make significant deviations from its projected course. However, the FOMC’s accuracy suffers materially when we extend their gaze beyond the short-term and into the following year’s end.
- Using September and December Dot Plot reports since 2012 11, the FOMC’s projections covering approximately a 15- to 12-month period, stand at 0.559553 and 0.690898, respectively.
- Using March and June Dot Plot reports since 2012 11, the FOMC’s projections covering approximately a 24 to 18-month period, stand at 0.165848 and 0.454774, respectively.
Furthermore, the FOMC’s forecasts for interest rates 2 years out by the end of that year are particularly surprising.
- Using September and December Dot Plot reports since 2012 11, the FOMC’s projections covering approximately a 27- to 24-month period, stand at -0.529200 and -0.306760, respectively.
- Using March and June Dot Plot reports since 2012 11, the FOMC’s projections covering approximately a 33- to 30-month period, stand at -0.420148 and -0.576766, respectively.
As the data suggests, the picture changes drastically when forecasting rates past the very short term (approx. 3-12 months). In fact, history shows investors would arguably have been better off positioning their portfolios for the exact opposite of the Fed’s two-year dot plot average prediction. The lesson to be learned is that we ought to derive insights from fundamentals instead of solely concentrating on momentum from swings in the Federal Reserve’s preferences, expectations, or (put directly) guesses regarding the long-term behavior of interest rates.
Summit Snapshot: Navigating the Essence of it All.
While it is tempting to seek the Holy Grail of accurate forecasting, the reality is that both equity and fixed income returns are inherently difficult to predict. We emphasize the shortcomings of the Fed Dot Plot not as a form of criticism – as we acknowledge the Fed is doing the best it can – but as a fair warning that attempting to predict rates tends to produce poor results. And as we see in the illustration below, episodes of volatility arise when financial markets grow concerned when consensus expectations significantly deviate from Fed Policy.
Figure 8: Bumpy Road when the Fed Fails to Meet Market Expectations (12/31/2022 – 01/31/2024) )8
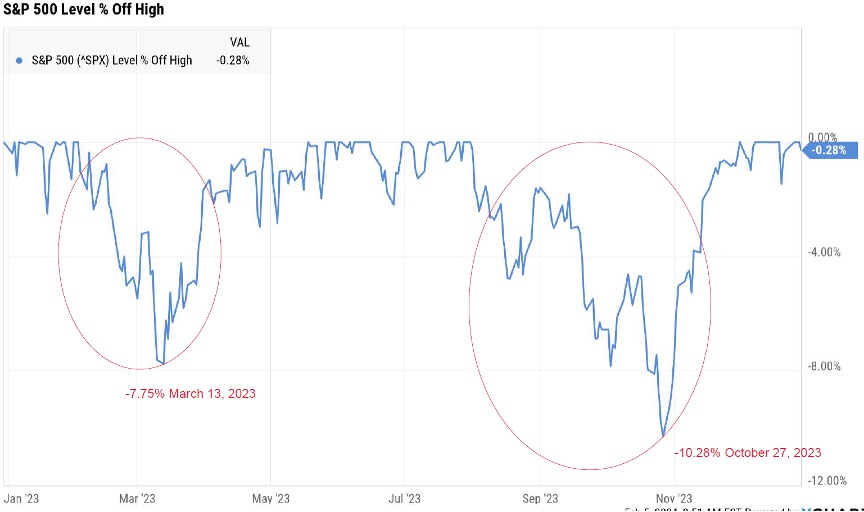
The economy, particularly inflation and maximum employment, is the driving force behind the Fed’s interest rate decisions. Staying true to a data dependent process, acknowledging the limitations of forecasting, and focusing on managing risk can help investors navigate the labyrinth of the markets with greater confidence.
As we look ahead, we anticipate economic tailwinds diminishing and headwinds intensifying, especially in the context of tighter monetary policy, decelerating growth, and a reduction in fiscal stimulus that helped boost employment and spending. Given these factors, we believe that investors should proceed with caution. While we maintain our long-term investment perspective and manage portfolios accordingly, we remain vigilant in this rapidly evolving environment, actively seeking tactical opportunities to capitalize on market dislocations to mitigate risk and enhance returns. We look forward to sharing these perspectives, allocation shifts, and new investment opportunities in more detail with our valued clients during upcoming conversations. In the meantime, please do not hesitate to reach out to the Aaron Wealth team with any questions.
Sources
1 Thomas M. Van Gulik (February 23, 2024), Babylonian clay tablet of the liver (online; NCBI). Available from: https://www.ncbi.nlm.nih.gov/pmc/articles/PMC9944526/ [Accessed February 13, 2024].
2 James Brigden (no date), 6 Ancient Roman Methods for Predicting the Future (online; Sky History). Available from: https://www.history.co.uk/articles/ancient-roman-methods-for-predicting-the-future [Accessed February 13, 2024].
3 Addepar
4 Sarah Foster; Brian Beers (December 13, 2023), The Federal Reserve’s latest dot plot, explained – and what this powerful tool says about interest rates (online; Bankrate). Available from: https://www.bankrate.com/banking/federal-reserve/how-to-read-fed-dot-plot-explained/#the-downside-of-the-fed-s-dot-plot [Accessed February 13, 2024].
5 Federal Reserve (December 13, 2023), Summary of Economic Projections (online; Federal Reserve). Available from: https://www.federalreserve.gov/monetarypolicy/fomcprojtabl20231213.htm [Accessed February 13, 2024].
6 Google Trends (no date), fed dot plot (online; Google). Available from: https://trends.google.com/trends/explore?q=fed%20dot%20plot&date=now%201-d&geo=US&hl=en. [Accessed February 13, 2024].
7 Bloomberg
8 Y-charts
9 Josh Wingrove (October 17, 2022), Forecast for US Recession Within Year Hits 100% in Blow to Biden (online; Bloomberg). Available from: https://www.bloomberg.com/news/articles/2022-10-17/forecast-for-us-recession-within-year-hits-100-in-blow-to-biden [Accessed February 13, 2024].
10 Robin Powell (December 14, 2023), Six Lessons on Investing from Charlie Munger (online; Timeline). Available from: https://www.timeline.co/blog/six-lessons-on-investing-from-charlie-munger [Accessed February 13, 2024].
11 Data for Calculations (online; Bloomberg); data frequency: quarterly [Accessed February 13, 2024].
Glenmede Investment Management (September 28, 2023), Market Snapshot: When Forecasting Interest Rates Gets Cloudy (online; Glenmede). Available from: https://www.glenmedeim.com/market-snapshot-when-forecasting-interest-rates-gets-cloudy/ [Accessed February 13, 2024].
DISCLAIMER
*Aaron Wealth Advisors LLC is registered as an investment adviser with the Securities and Exchange Commission (SEC). Aaron Wealth Advisors LLC only transacts business in states where it is properly registered or is excluded or exempted from registration requirements. SEC registration does not constitute an endorsement of the firm by the Commission nor does it indicate that the adviser has attained a particular level of skill or ability.
*This material is not intended to be a recommendation or investment advice, does not constitute a solicitation to buy or sell securities, and is not provided in a fiduciary capacity. The information provided does not take into account the specific objectives or circumstances or any particular investor or suggest any specific course of action. Investment decisions should be made based on an investor’s objectives and circumstances and in consultation with his or her advisors. The information contained in this presentation represents factual information, analysis, and/or opinions regarding various investments. Any opinions expressed in this material reflect Aaron Wealth’s views as of the date(s) indicated in the Presentation and are subject to change.
*Past performance may not be indicative of future results. Therefore, no current or prospective client should assume that the future performance of any specific investment, investment strategy (including the investments and/or investment strategies recommended by the adviser), or product made reference to directly or indirectly, will be profitable or equal to past performance levels.
*This document contains forward-looking statements, including observations about markets and industry and regulatory trends as of the original date of this document. Forward-looking statements may be identified by, among other things, the use of words such as ”expects,” “anticipates,” “believes,” or “estimates,” or the negatives of these terms, and similar express results could differ materially from those in the forward-looking statements as a result of factors beyond our control. Recipients of the information herein are cautioned not to place undue reliance on such statements. No party has an obligation to update any of the forward-looking or other statements in this document.
*All investment strategies have the potential for profit or loss. The investment strategies illustrated in this document and listed above involve risk, including the risk of loss of principal.
*The firm is not engaged in the practice of law or accounting. Content should not be construed as legal or tax advice. Always consult an attorney or tax professional regarding your specific legal or tax situation.
*This material is proprietary and may not be reproduced, transferred, modified or distributed in any form without prior written permission from Aaron Wealth Advisors. Aaron Wealth reserves the right, at any time and without notice, to amend, or cease publication of the information contained herein. Certain of the information contained herein has been obtained from third-party sources and has not been independently verified. It is made available on an “as is” basis without warranty. Any strategies or investment programs described in this presentation are provided for educational purposes only and are not necessarily indicative of securities offered for sale or private placement offerings available to any investor.